

Question: Please help SF eSantaFe | Santa Fe College | C arket Equi eSantaFe - My FA - C ezto.mheducation.com/ext/map/index.html?_con=con&external_browser=0&launchUrl=https%253A%252F% HW - Market Equil. and Policy
Please help
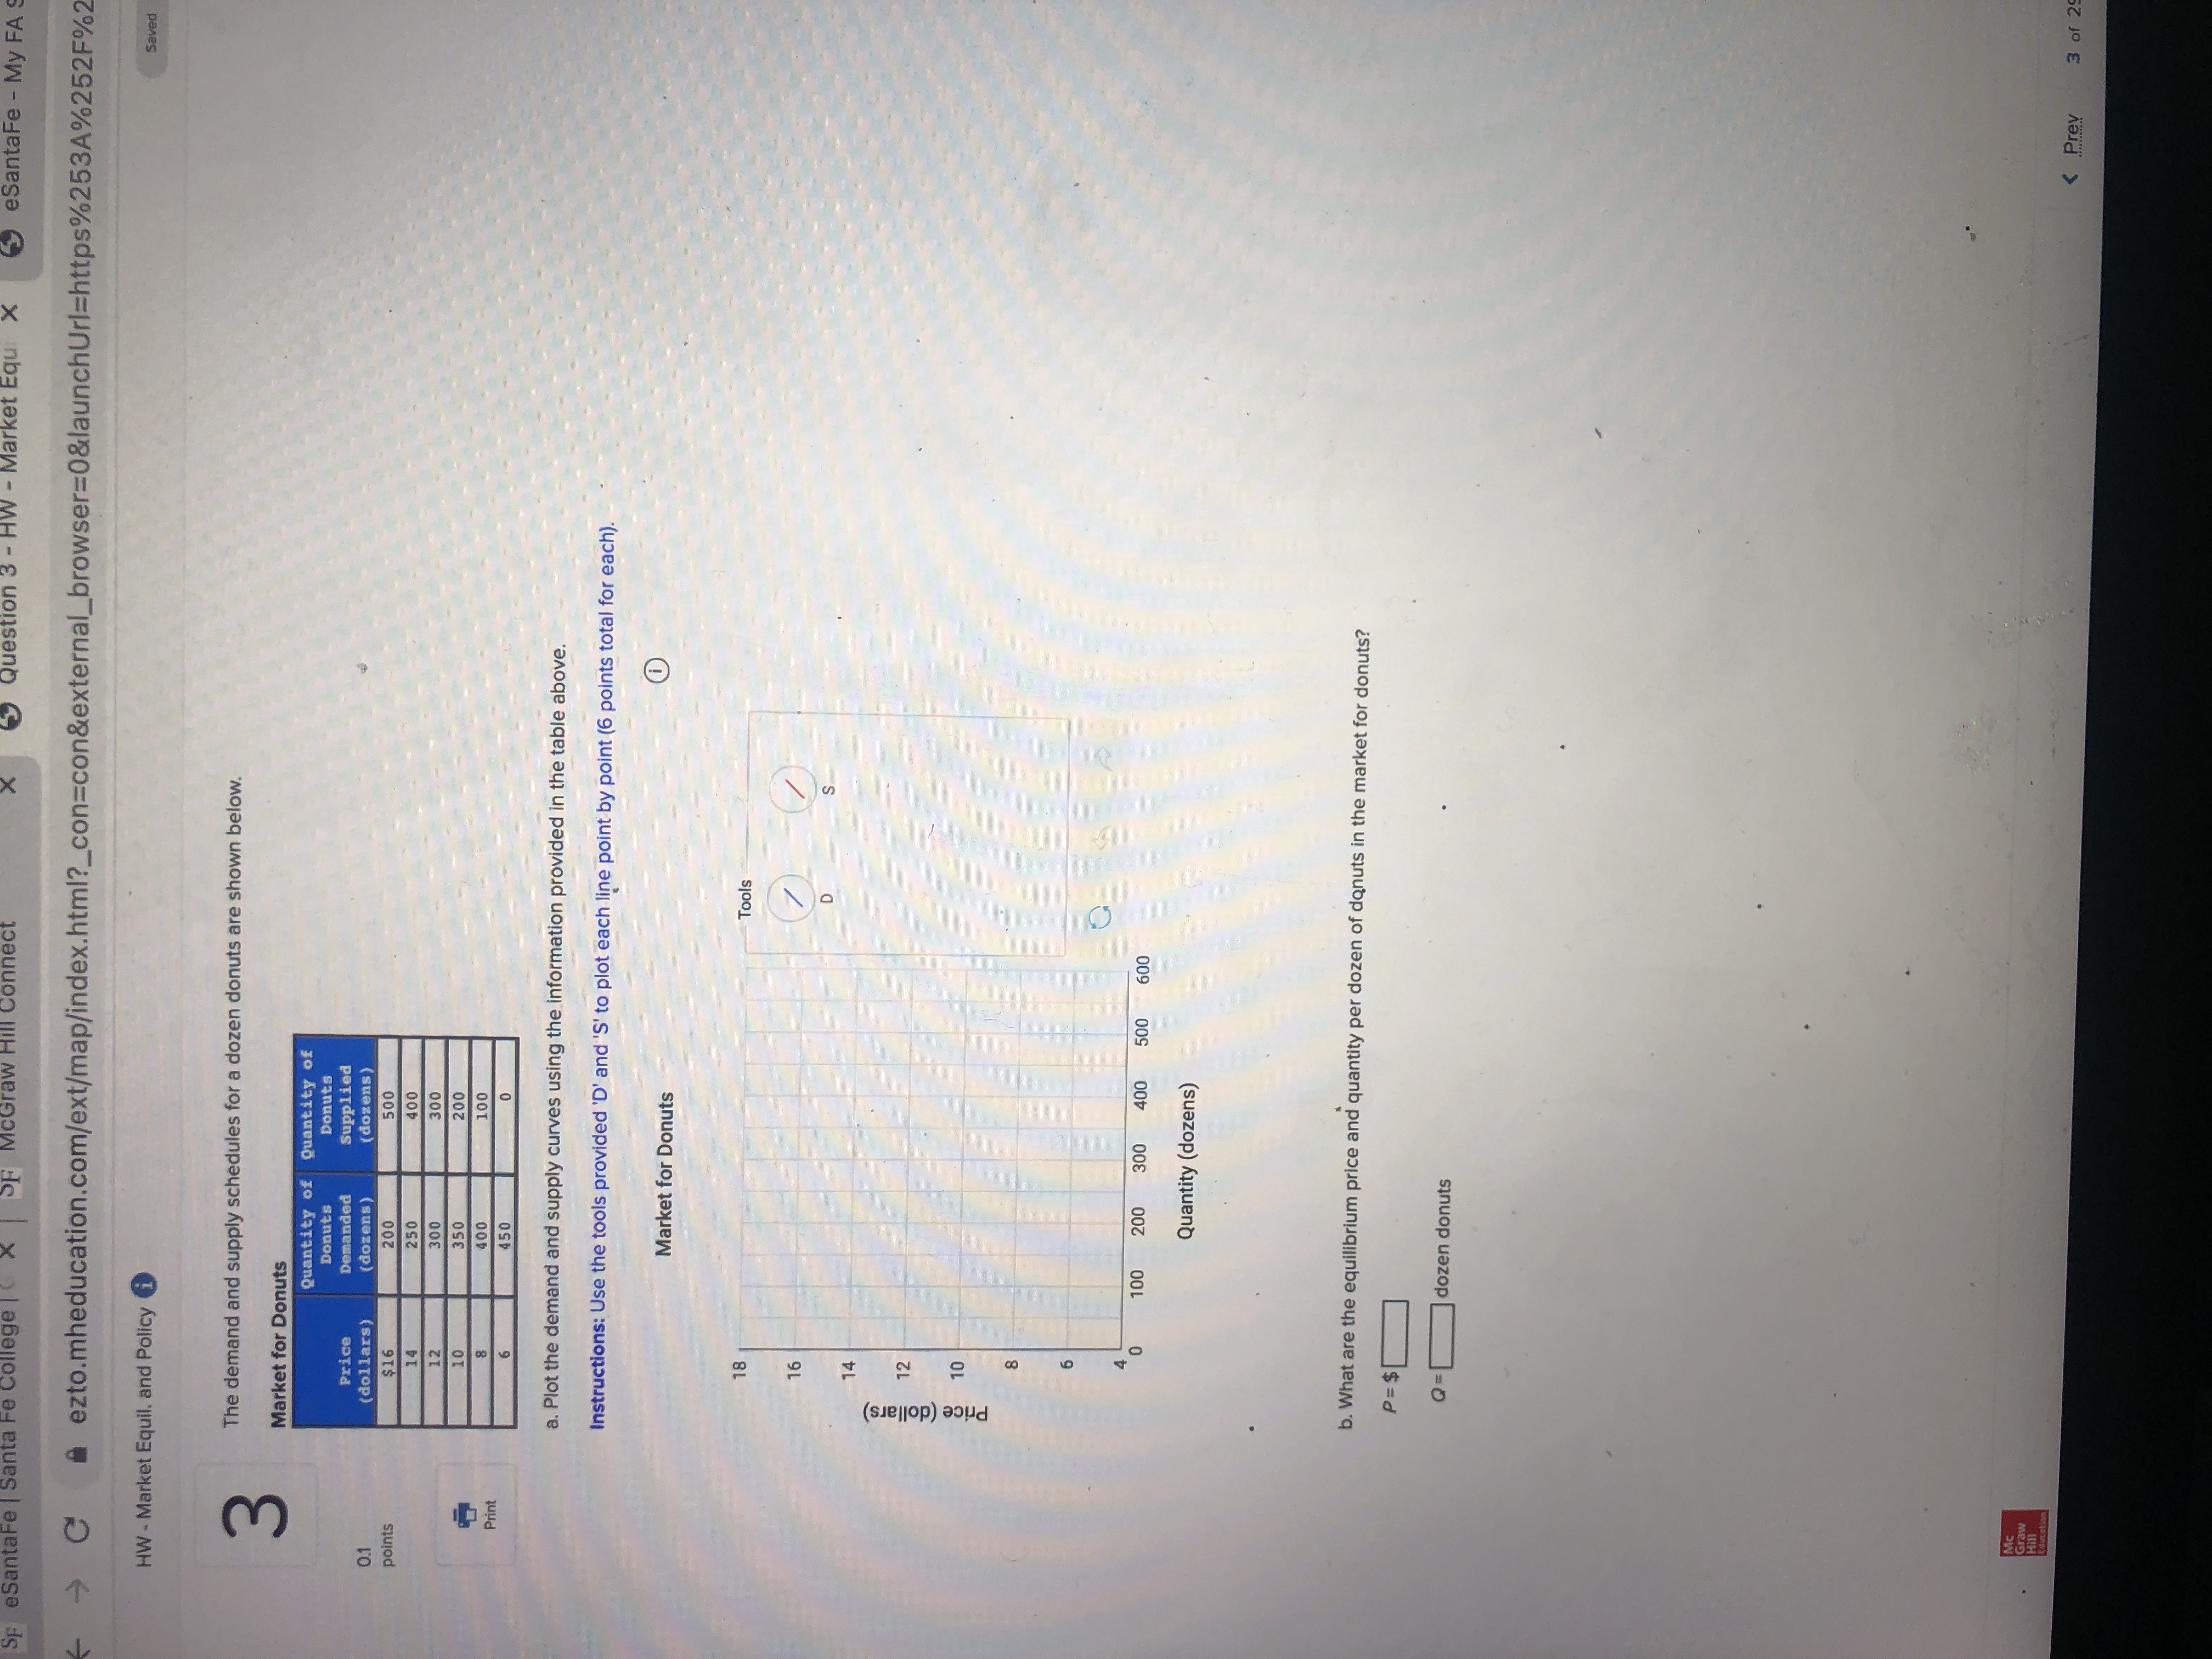
SF eSantaFe | Santa Fe College | C arket Equi eSantaFe - My FA - C ezto.mheducation.com/ext/map/index.html?_con=con&external_browser=0&launchUrl=https%253A%252F% HW - Market Equil. and Policy i Saved 3 The demand and supply schedules for a dozen donuts are shown below. Market for Donuts Quantity of Quantity of Donuts Donuts Price Demanded Supplied 0.1 (dollars) (dozens) dozens) points $16 200 500 14 250 400 12 300 300 350 200 Print 400 100 450 a. Plot the demand and supply curves using the information provided in the table above. Instructions: Use the tools provided 'D' and 'S' to plot each line point by point (6 points total for each). Market for Donuts 18 Tools 16 14 12 Price (dollars 10 100 200 300 400 500 600 Quantity (dozens) b. What are the equilibrium price and quantity per dozen of donuts in the market for donuts? P = $[ a = ] dozen donuts
Step by Step Solution
There are 3 Steps involved in it

Get step-by-step solutions from verified subject matter experts