

Question: PLEASE HELP Show all work clearly and readable 1. Consider the line spectra and plots of x(t) shown in Figures 1 and 2 . (a)
PLEASE HELP
Show all work clearly and readable
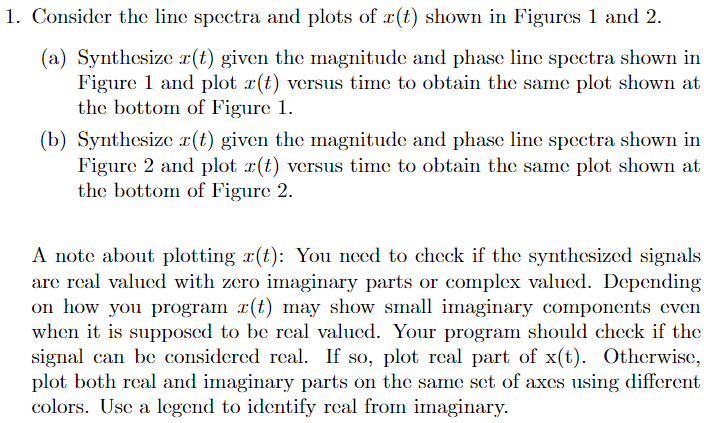
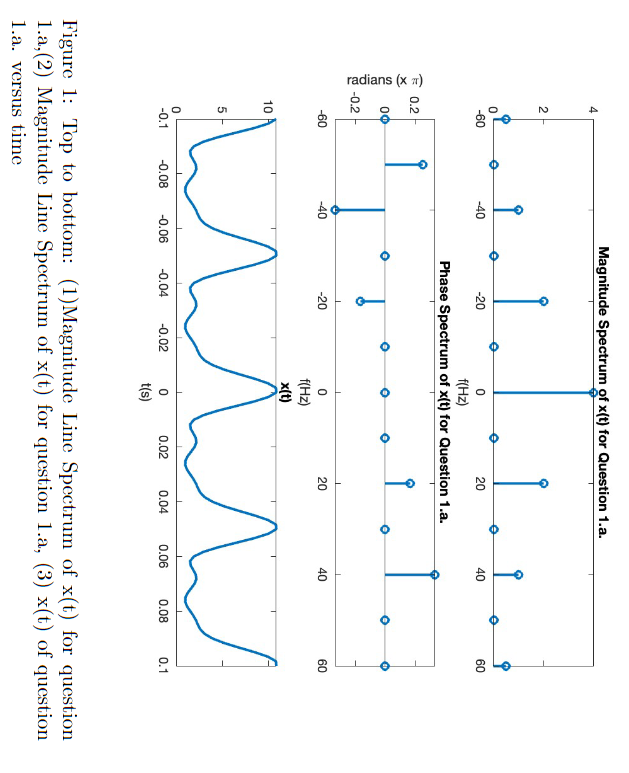
1. Consider the line spectra and plots of x(t) shown in Figures 1 and 2 . (a) Synthesize x(t) given the magnitude and phase line spectra shown in Figure 1 and plot x(t) versus time to obtain the same plot shown at the bottom of Figure 1. (b) Synthesize x(t) given the magnitude and phase line spectra shown in Figure 2 and plot x(t) versus time to obtain the same plot shown at the bottom of Figure 2 . A note about plotting x(t) : You need to check if the synthesized signals are real valued with zero imaginary parts or complex valued. Depending on how you program x(t) may show small imaginary components even when it is supposed to be real valued. Your program should check if the signal can be considered real. If so, plot real part of x(t). Otherwise, plot both real and imaginary parts on the same set of axes using different colors. Use a legend to identify real from imaginary. Figure 2: Top to bottom: (1)Magnitude Line Spectrum of x(t) for question 1.b, (2) Magnitude Line Spectrum of x(t) for question 1.b, (3) x(t) of question 1.b. versus time 1. Consider the line spectra and plots of x(t) shown in Figures 1 and 2 . (a) Synthesize x(t) given the magnitude and phase line spectra shown in Figure 1 and plot x(t) versus time to obtain the same plot shown at the bottom of Figure 1. (b) Synthesize x(t) given the magnitude and phase line spectra shown in Figure 2 and plot x(t) versus time to obtain the same plot shown at the bottom of Figure 2 . A note about plotting x(t) : You need to check if the synthesized signals are real valued with zero imaginary parts or complex valued. Depending on how you program x(t) may show small imaginary components even when it is supposed to be real valued. Your program should check if the signal can be considered real. If so, plot real part of x(t). Otherwise, plot both real and imaginary parts on the same set of axes using different colors. Use a legend to identify real from imaginary. Figure 2: Top to bottom: (1)Magnitude Line Spectrum of x(t) for question 1.b, (2) Magnitude Line Spectrum of x(t) for question 1.b, (3) x(t) of question 1.b. versus time
Step by Step Solution
There are 3 Steps involved in it

Get step-by-step solutions from verified subject matter experts