

Question: Please help solve each part Simon Company's year-end balance sheets follow. At December 31 Assets Cash Accounts receivable, net Merchandise inventory Prepaid expenses Plant assets,
Please help solve each part
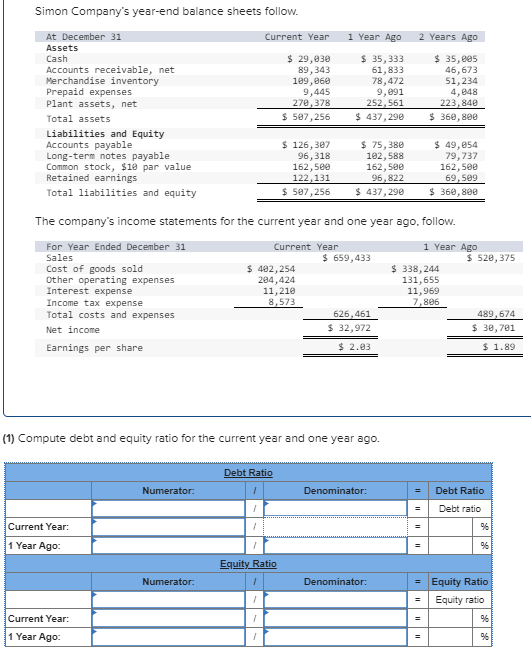
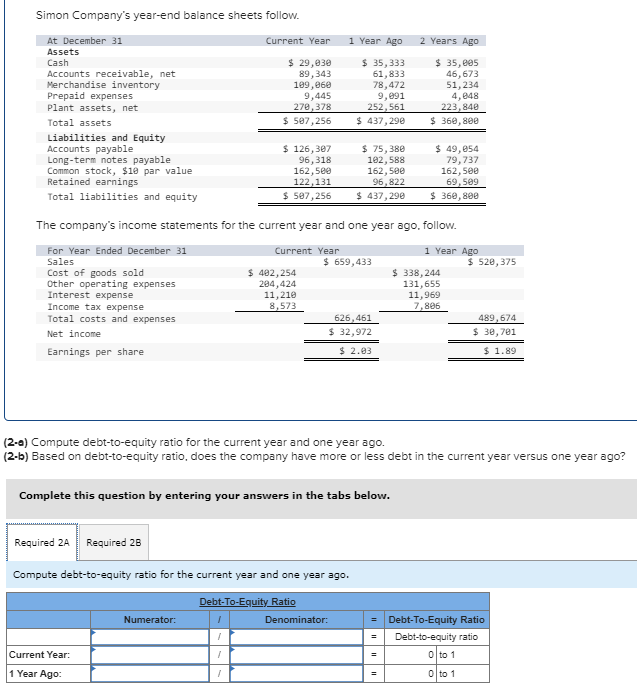
Simon Company's year-end balance sheets follow. At December 31 Assets Cash Accounts receivable, net Merchandise inventory Prepaid expenses Plant assets, net Total assets Liabilities and Equity Accounts payable Long-term notes payable Common stock, $10 par value Retained earnings Total liabilities and equity Current Year: 1 Year Ago: Current Year: 1 Year Ago: Current Year $ 29,030 89,343 109,060 9,445 270,378 $ 507,256 Numerator: Numerator: $ 126,307 96,318 162,500 122,131 $ 507,256 The company's income statements for the current year and one year ago, follow. For Year Ended December 31 Sales Cost of goods sold Other operating expenses Interest expense Income tax expense Total costs and expenses Net income Earnings per share. Current Year $ 402,254 284,424 11,210 8,573 Debt Ratio 1 Year Ago $ 35,333 61,833 78,472 9,091 252,561 $ 437,290 (1) Compute debt and equity ratio for the current year and one year ago. 1 1 Equity Ratio 1 I I I $ 75,380 102,588 162,500 96,822 $ 437,290 $ 659,433 626,461 $ 32,972 $2.03 Denominator: 2 Years Ago $ 35,005 46,673 51,234 4,048 223,840 $360,800 Denominator: $ 49,054 79,737 162,500 69,509 $360,800 1 Year Ago $ 338,244 131,655 = 11,969 7,806 $ 520,375 489,674 $ 30,701 $ 1.89 Debt Ratio Debt ratio %6 %6 = Equity Ratio Equity ratio %6 %6 Simon Company's year-end balance sheets follow. At December 31 Assets Cash Accounts receivable, net Merchandise inventory Prepaid expenses Plant assets, net Total assets Liabilities and Equity Accounts payable Long-term notes payable Common stock, $10 par value Retained earnings Total liabilities and equity Income tax expense Total costs and expenses Net income Earnings per share. Current Year Current Year: 1 Year Ago: $ 29,030 89,343 109,060 9,445 270,378 $ 507,256 Numerator: $ 126,307 96,318 162,500 122,131 $ 507,256 The company's income statements for the current year and one year ago, follow. For Year Ended December 31 Current Year 1 Year Ago Sales Cost of goods sold Other operating expenses Interest expense 1 1 1 1 $ 482,254 284,424 11,210 8,573 1 Year Ago $ 35,333 61,833 78,472 9,091 252,561 $ 437,290 Complete this question by entering your answers in the tabs below. Required 2A Required 28 Compute debt-to-equity ratio for the current year and one year ago. Debt-To-Equity Ratio $ 75,380 102,588 162,500 96,822 $ 437,290 $ 659,433 626,461 $ 32,972 $2.03 Denominator: (2-a) Compute debt-to-equity ratio for the current year and one year ago. (2-b) Based on debt-to-equity ratio, does the company have more or less debt in the current year versus one year ago? 2 Years Ago $ 35,005 46,673 51,234 4,848 223,840 $360,800 $ 49,054 79,737 162,500 69,509 $ 360,800 = $ 338,244 131,655 11,969 7,806 $ 520,375 489,674 $ 30,701 $ 1.89 Debt-To-Equity Ratio Debt-to-equity ratio 0 to 1 0 to 1
Step by Step Solution
There are 3 Steps involved in it

Get step-by-step solutions from verified subject matter experts