

Question: please help solve for a & b using in excel. 12.16. The town aquatic center has an indoor pool that has lanes for lap swimming
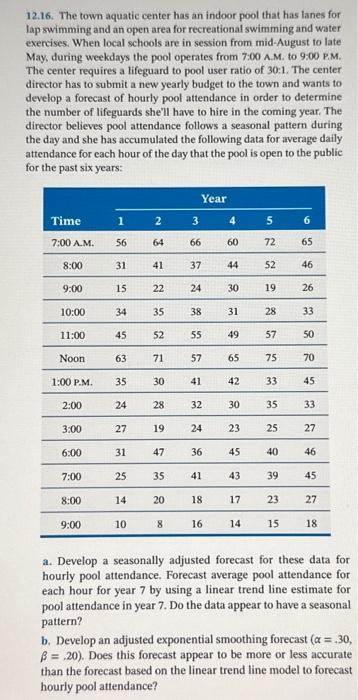
12.16. The town aquatic center has an indoor pool that has lanes for lap swimming and an open area for recreational swimming and water exercises. When local schools are in session from mid-August to late May, during weekdays the pool operates from 7:00 A.M. to 9:00 P.M. The center requires a lifeguard to pool user ratio of 30:1. The center director has to submit a new yearly budget to the town and wants to develop a forecast of hourly pool attendance in order to determine the number of lifeguards she'll have to hire in the coming year. The director believes pool attendance follows a seasonal pattern during the day and she has accumulated the following data for average daily attendance for each hour of the day that the pool is open to the public for the past six years: a. Develop a seasonally adjusted forecast for these data for hourly pool attendance. Forecast average pool attendance for each hour for year 7 by using a linear trend line estimate for pool attendance in year 7. Do the data appear to have a seasonal pattern? b. Develop an adjusted exponential smoothing forecast (=,30, =,20 ). Does this forecast appear to be more or less accurate than the forecast based on the linear trend line model to forecast hourly pool attendance
Step by Step Solution
There are 3 Steps involved in it

Get step-by-step solutions from verified subject matter experts