

Question: please help solve the full problem the full problem is pictured in the first photo but its a litttle blurry, here is more of the
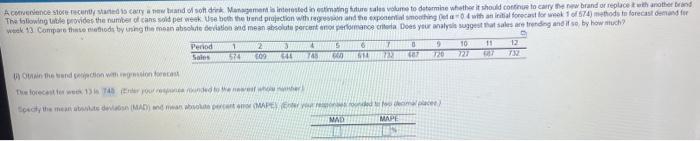
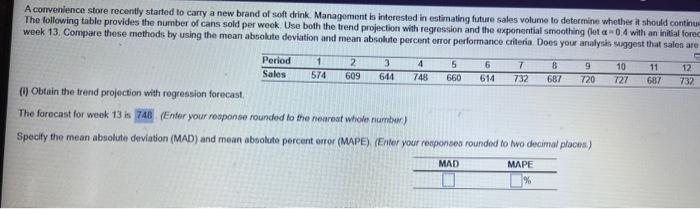
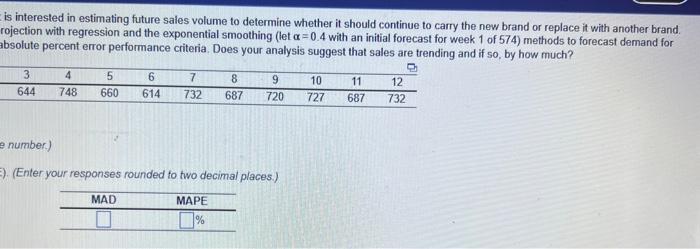
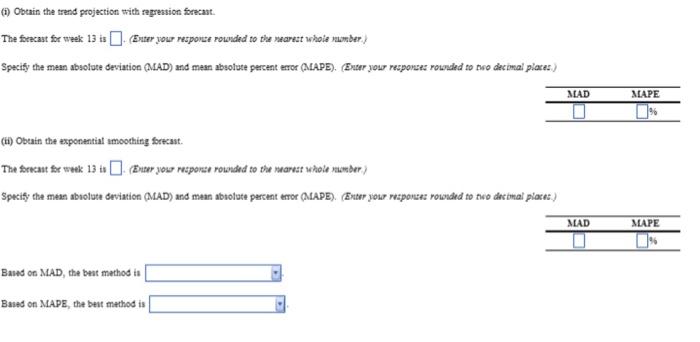
A convenience store recently started to carry a new brand of soft drink Management is interested in estimating future sales volume to determine whether it should continue to carry the new brand or replace it with another brand The following table provides the number of cans sold per week. Use both the trend projection with regression and the exponential smoothing (et a-04 with an initial forecast for week 1 of 574) methods to forecast demand for week 13 Compare these methods by uning the mean absolute deviation and mean absolute percent enor performance criteria Does your analysis suggest that sales are trending and if so, by how much? Period Sales 2 1 574 609 4 3 444 748 Otrain the band peojection with regression forecast her The forecast for week 13 748 (Ender your respons rounded to the nearest who Specly the mean abesluite deviation (MAD) and mean absolute percent amor (MAPE) Enter S 640 MAD 6 7 614 1732 0 487 9 720 onded to deal place MAPE 10 727 11 687 12 732 A convenience store recently started to carry a new brand of soft drink. Management is interested in estimating future sales volume to determine whether it should continue The following table provides the number of cans sold per week. Use both the trend projection with regression and the exponential smoothing (let a-0.4 with an initial forect week 13. Compare these methods by using the mean absolute deviation and mean absolute percent error performance criteria. Does your analysis suggest that sales are - Period Sales 1 2 574 609 3 644 4 748 5 660 8 6 7 614 732 687 9 720 (1) Obtain the trend projection with regression forecast. The forecast for week 13 is 748 (Enter your response rounded to the nearest whole number) Specify the mean absolute deviation (MAD) and mean absolute percent error (MAPE). (Enter your responses rounded to two decimal places) MAD MAPE 10 727 11 687 12 732 is interested in estimating future sales volume to determine whether it should continue to carry the new brand or replace it with another brand. rojection with regression and the exponential smoothing (let a=0.4 with an initial forecast for week 1 of 574) methods to forecast demand for absolute percent error performance criteria. Does your analysis suggest that sales are trending and if so, by how much? 3 644 4 5 748 660 7 6 614 732 8 687 9 720 number) E) (Enter your responses rounded to two decimal places.) MAD MAPE 10 727 11 12 687 732 (1) Obtain the trend projection with regression forecast. The forecast for week 13 is. (Enter your response rounded to the nearest whole number.) Specify the mean absolute deviation (MAD) and mean absolute percent error (MAPE). (Enter your responses rounded to two decimal places) (ii) Obtain the exponential smoothing forecast. The forecast for week 13 is. (Enter your responce rounded to the nearest whole number) Specify the mean absolute deviation (MAD) and mean absolute percent error (MAPE). (Enter your responses rounded to two decimal places) Based on MAD, the best method is Based on MAPE, the best method is MAD MAD MAPE MAPE
Step by Step Solution
There are 3 Steps involved in it

Get step-by-step solutions from verified subject matter experts