

Question: Please help!!! Speeded Reaction Time Estimated time to complete lab: 25 minutes Frequency Distribution This experiment has a very simple task: Respond with a key
Please help!!!
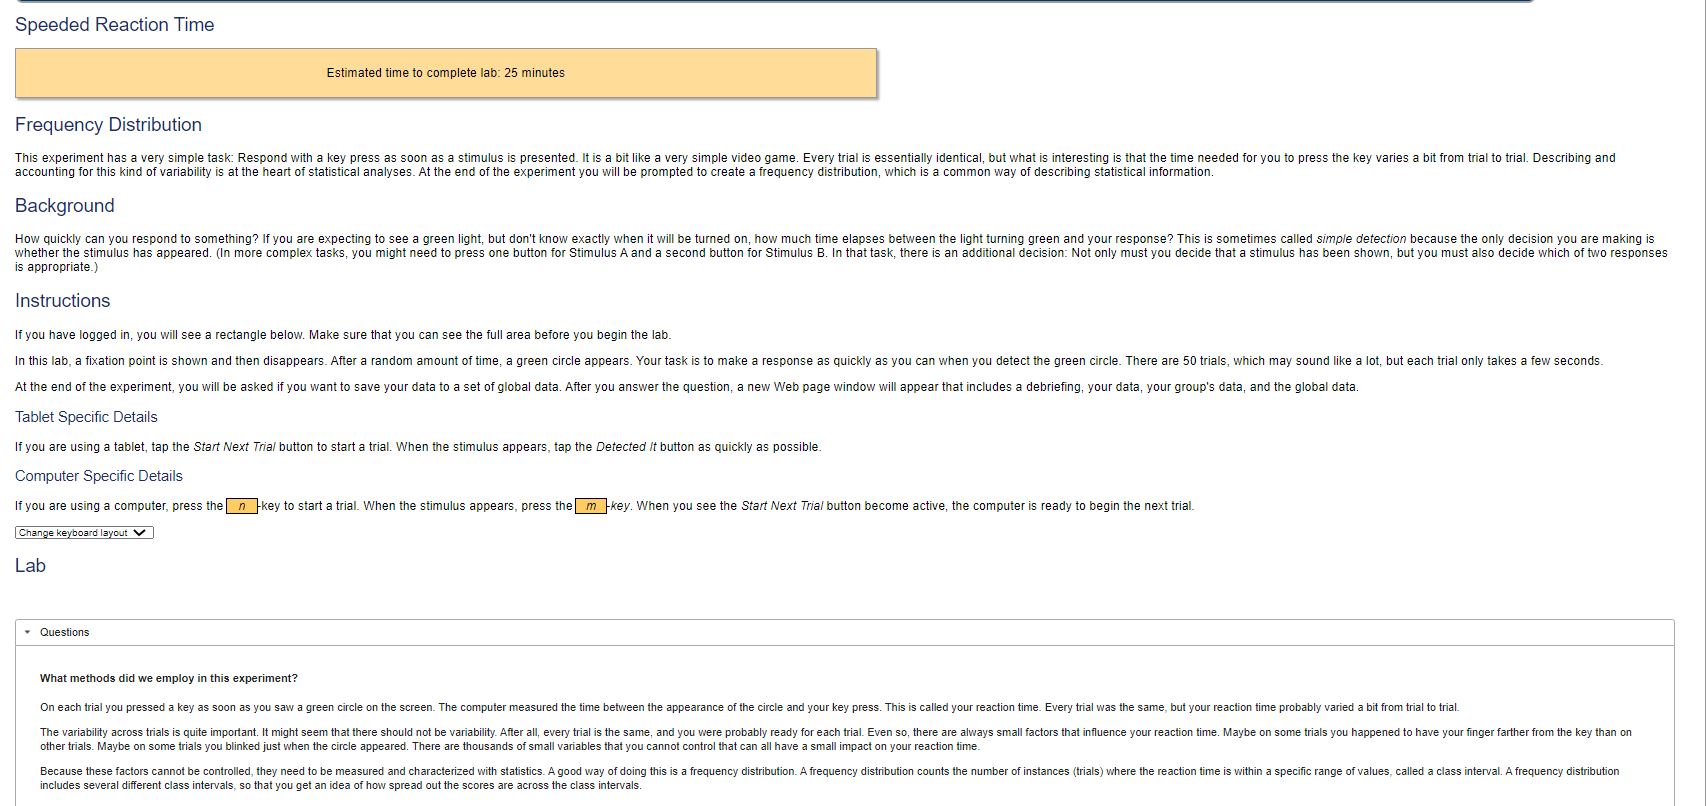
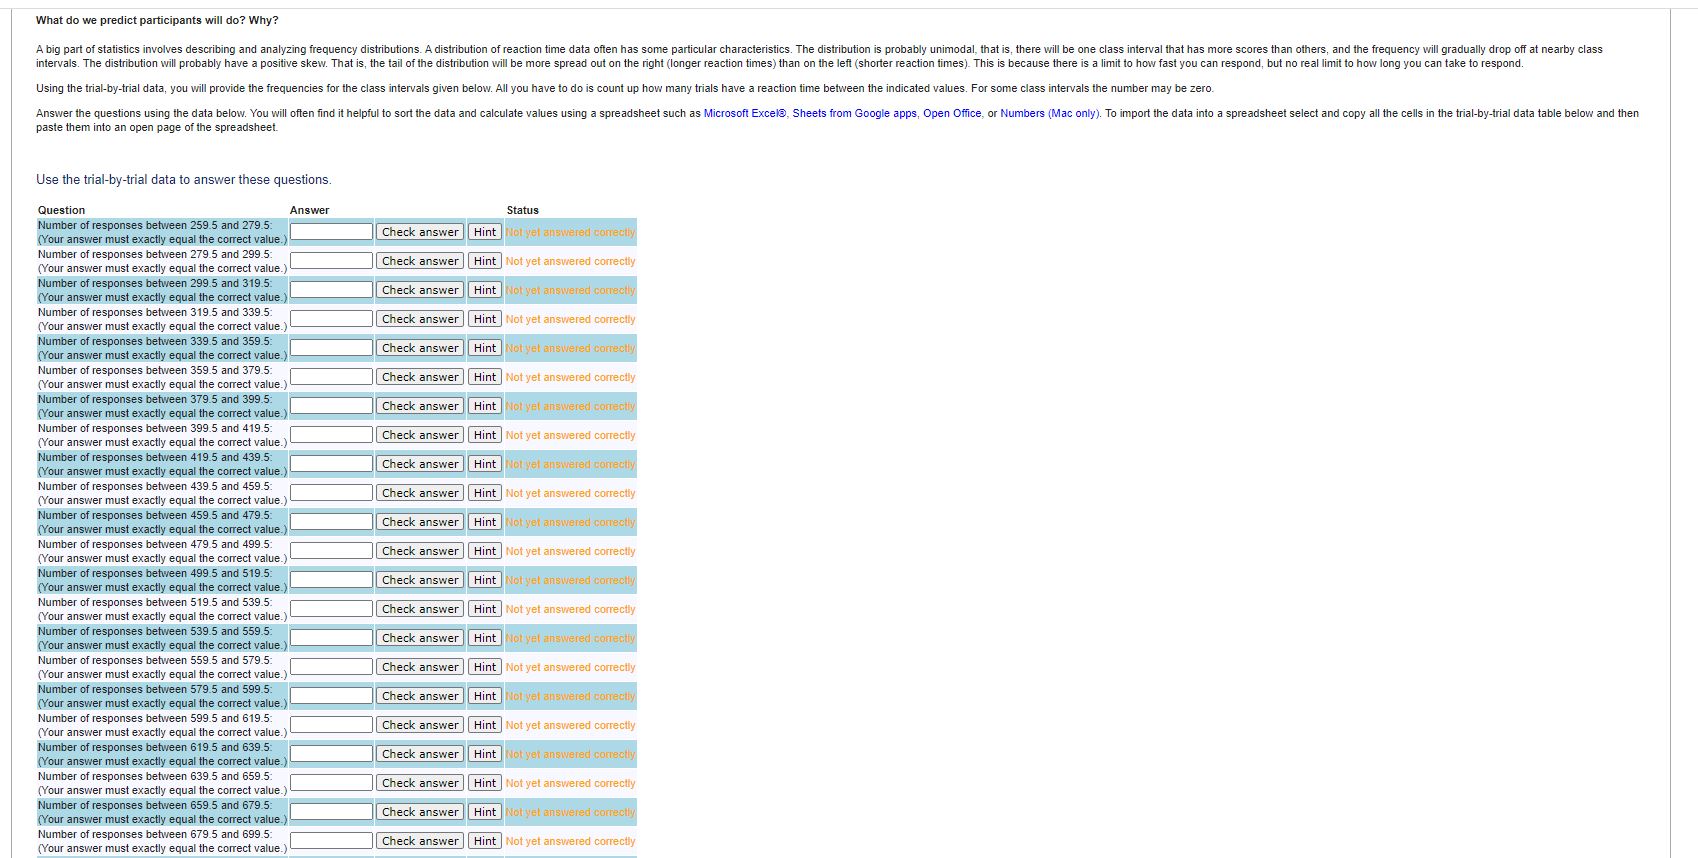
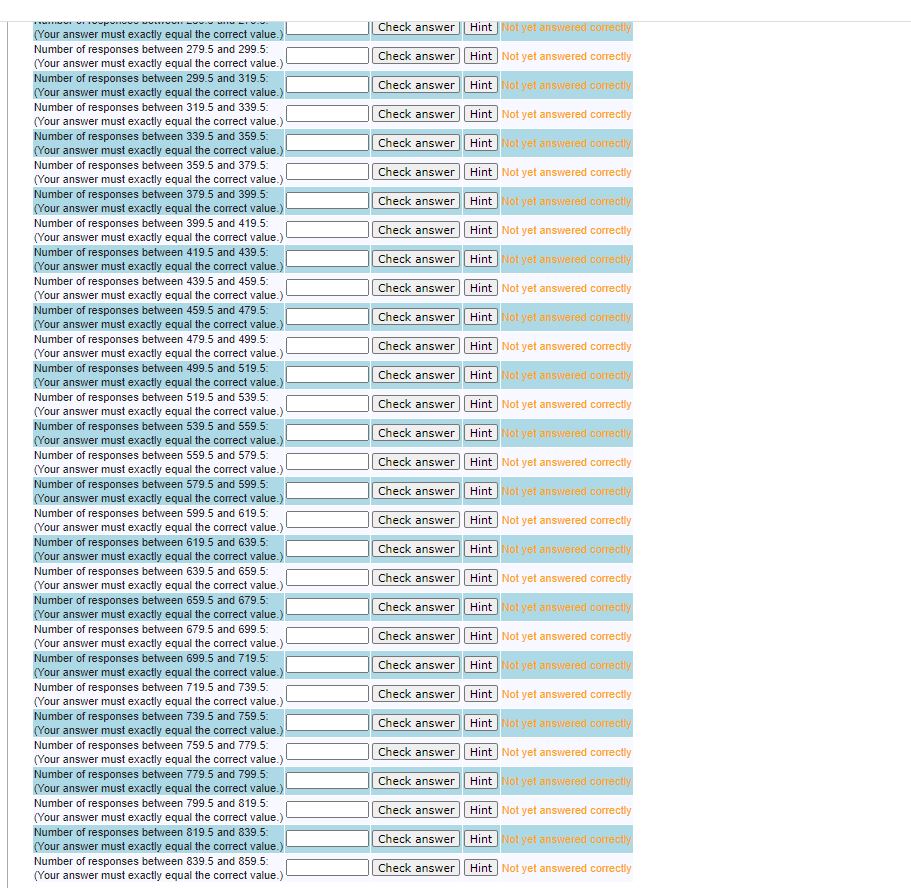

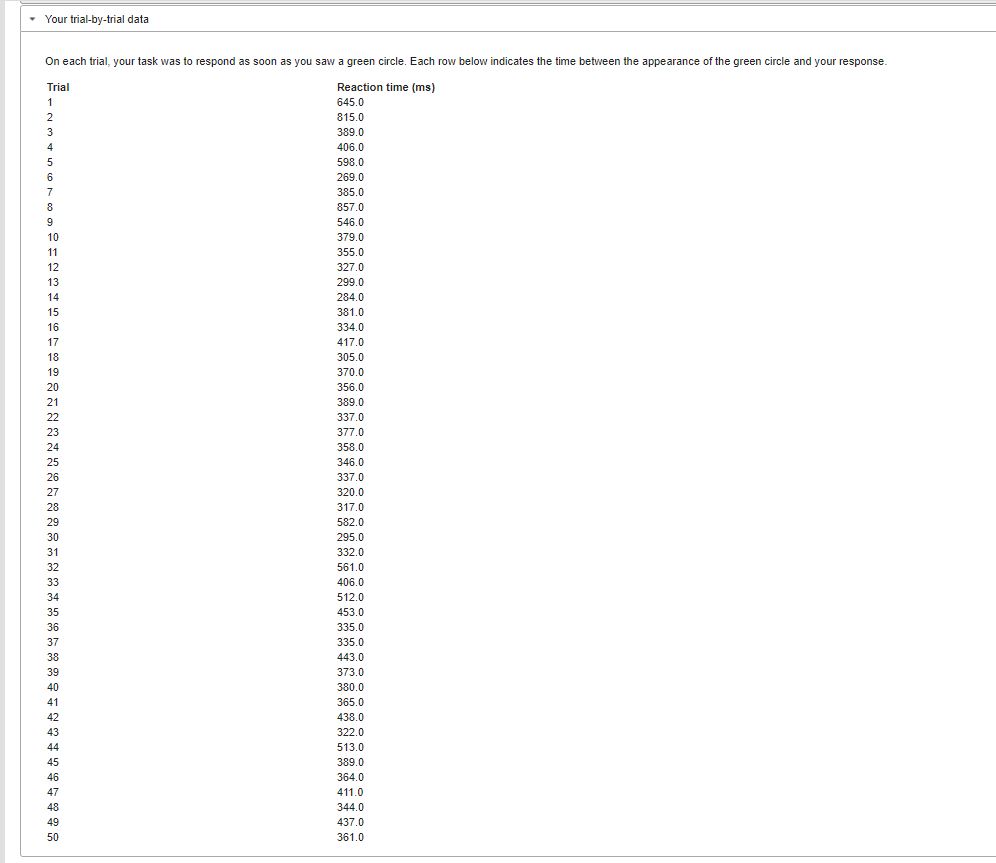
Speeded Reaction Time Estimated time to complete lab: 25 minutes Frequency Distribution This experiment has a very simple task: Respond with a key press as soon as a stimulus is presented. It is a bit like a very simple video game. Every trial is essentially identical, but what is interesting is that the time needed for you to press the key varies a bit from trial to trial. Describing and accounting for this kind of variability is at the heart of statistical analyses. At the end of the experiment you will be prompted to create a frequency distribution, which is a common way of describing statistical information. Background How quickly can you respond to something? If you are expecting to see a green light, but don't know exactly when it will be turned on, how much time elapses between the light turning green and your response? This is sometimes called simple defection because the only decision you are making is whether the stimulus has appeared. (In more complex tasks, you might need to press one button for Stimulus A and a second button for Stimulus B. In that task, there is an additional decision: Not only must you decide that a stimulus has been shown, but you must also decide which of two responses is appropriate.) Instructions If you have logged in, you will see a rectangle below. Make sure that you can see the full area before you begin the lab. In this lab, a fixation point is shown and then disappears. After a random amount of time, a green circle appears. Your task is to make a response as quickly as you can when you detect the green circle. There are 50 trials, which may sound like a lot, but each trial only takes a few seconds. At the end of the experiment, you will be asked if you want to save your data to a set of global data. After you answer the question, a new Web page window will appear that includes a debriefing, your data, your group's data, and the global data. Tablet Specific Details If you are using a tablet, tap the Start Next Thal button to start a trial. When the stimulus appears, tap the Detected it button as quickly as possible. Computer Specific Details If you are using a computer, press the n -key to start a trial. When the stimulus appears, press them -key. When you see the Start Next Trial button become active, the computer is ready to begin the next trial. Change keyboard layout V Lab Questions What methods did we employ in this experiment? On each trial you pressed a key as soon as you saw a green circle on the screen. The computer measured the time between the appearance of the circle and your key press. This is called your reaction time. Every trial was the same, but your reaction time probably varied a bit from trial to trial. The variability across trials is quite important. It might seem that there should not be variability. After all, every trial is the same, and you were probably ready for each trial. Even so, there are always small factors that influence your reaction time. Maybe on some trials you happened to have your finger farther from the key than on other trials. Maybe on some trials you blinked just when the circle appeared. There are thousands of small variables that you cannot control that can all have a small impact on your reaction time. Because these factors cannot be controlled, they need to be measured and characterized with statistics. A good way of doing this is a frequency distribution. A frequency distribution counts the number of instances (trials) where the reaction time is within a specific range of values, called a class interval. A frequency distribution includes several different class intervals, so that you get an idea of how spread out the scores are across the class intervals.What do we predict participants will do? Why? A big part of statistics involves describing and analyzing frequency distributions. A distribution of reaction time data often has some particular characteristics. The distribution is probably unimodal, that is, there will be one class interval that has more scores than others, and the frequency will gradually drop off at nearby class intervals. The distribution will probably have a positive skew. That is, the tail of the distribution will be more spread out on the right (longer reaction times) than on the left (shorter reaction times). This is because there is a limit to how fast you can respond, but no real limit to how long you can take to respond. Using the trial-by-trial data, you will provide the frequencies for the class intervals given below. All you have to do is count up how many trials have a reaction time between the indicated values. For some class intervals the number may be zero. Answer the questions using the data below. You will often find it helpful to sort the data and calculate values using a spreadsheet such as Microsoft Excel, Sheets from Google apps, Open Office, or Numbers (Mac only). To import the data into a spreadsheet select and copy all the cells in the trial-by-trial data table below and then paste them into an open page of the spreadsheet. Use the trial-by-trial data to answer these questions. Question Answer Status Number of responses between 259.5 and 279.5: (Your answer must exactly equal the correct value.) Check answer Hint | Not yet answered correctly Number of responses between 279.5 and 299.5: (Your answer must exactly equal the correct value. Check answer| |Hint | Not yet answered correctly Number of responses between 299.5 and 319.5: (Your answer must exactly equal the correct value.) Check answer| |Hint Not yet answered correctly Number of responses between 319.5 and 339.5: (Your answer must exactly equal the correct value.) Check answer| |Hint | Not yet answered correctly Number of responses between 339.5 and 359.5: (Your answer must exactly equal the correct value.) Check answer Hint| Not yet answered correctly Number of responses between 359.5 and 379.5: (Your answer must exactly equal the correct value.) Check answer | |Hint| Not yet answered correctly Number of responses between 379.5 and 399.5: (Your answer must exactly equal the correct value.) Check answer Hint Not yet answered correctly Number of responses between 399.5 and 419.5: (Your answer must exactly equal the correct value.) Check answer| |Hint | Not yet answered correctly Number of responses between 419.5 and 439.5: (Your answer must exactly equal the correct value.) Check answer | |Hint | Not yet answered correctly Number of responses between 439.5 and 459.5 (Your answer must exactly equal the correct value.) Check answer Hint | Not yet answered correctly Number of responses between 459.5 and 479.5: (Your answer must exactly equal the correct value.) Check answer Hint| Not yet answered correctly Number of responses between 479.5 and 499.5: (Your answer must exactly equal the correct value.) Check answer| |Hint | Not yet answered correctly Number of responses between 499.5 and 519.5: (Your answer must exactly equal the correct value.) Check answer Hint|Not yet answered correct Number of responses between 519.5 and 539.5: (Your answer must exactly equal the correct value.) Check answer| |Hint| Not yet answered correctly Number of responses between 539.5 and 559.5 (Your answer must exactly equal the correct value.) Check answer Hint| Not yel answered correctly Number of responses between 559.5 and 579.5: (Your answer must exactly equal the correct value.) Check answer | |Hint | Not yet answered correctly Number of responses between 579.5 and 599.5: (Your answer must exactly equal the correct value.) Check answer| |Hint | Not yet answered correctly Number of responses between 599.5 and 619.5: (Your answer must exactly equal the correct value. Check answer|Hint| Not yet answered correctly Number of responses between 619.5 and 639.5: (Your answer must exactly equal the correct value.) Check answer Hint N Not yet answered correctry Number of responses between 639.5 and 659.5: (Your answer must exactly equal the correct value.) Check answer| | Hint | Not yet answered correctly Number of responses between 659.5 and 679.5: (Your answer must exactly equal the correct value.) Check answer Hint | Not yet answered correctly Number of responses between 679.5 and 699.5: (Your answer must exactly equal the correct value.) Check answer | | Hint | Not yet answered correctly(Your answer must exactly equal the correct value.) Check answer | | Hint | Not yet answered correctly Number of responses between 279.5 and 299.5 (Your answer must exactly equal the correct value. Check answer | |Hint | Not yet answered correctly Number of responses between 299.5 and 319.5: (Your answer must exactly equal the correct value.) Check answer| |Hint| Not yet answered correctly Number of responses between 319.5 and 339.5: Your answer must exactly equal the correct value. Check answer | |Hint | Not yet answered correctly Number of responses between 339.5 and 359.5: (Your answer must exactly equal the correct value.) Check answer Hint| Not yet answered correctly Number of responses between 359.5 and 379.5: (Your answer must exactly equal the correct value.) Check answer | | Hint | Not yet answered correctly Number of responses between 379.5 and 399.5: (Your answer must exactly equal the correct value.) Check answer Hint|Not yet answered correctly Number of responses between 399.5 and 419.5: (Your answer must exactly equal the correct value.) Check answer| | Hint | Not yet answered correctly Number of responses between 419.5 and 439.5: (Your answer must exactly equal the correct value. Check answer|Hint| Not yet answered correct Number of responses between 439.5 and 459.5 (Your answer must exactly equal the correct value. Check answer| |Hint | Not yet answered correctly Number of responses between 459.5 and 479.5 (Your answer must exactly equal the correct value.) Check answer | | Hint | Not yet answered correctly Number of responses between 479.5 and 499.5: (Your answer must exactly equal the correct value.) Check answer|Hint | Not yet answered correctly Number of responses between 499.5 and 519.5: Your answer must exactly equal the correct value.) Check answer Hint| Not yet answered correcthy Number of responses between 519.5 and 539.5: Your answer must exactly equal the correct value.) Check answer| |Hint | Not yet answered correctly Number of responses between 539.5 and 559.5: (Your answer must exactly equal the correct value.) Check answer Hint| Not yet answered correctly Number of responses between 559.5 and 579.5: (Your answer must exactly equal the correct value.) Check answer| |Hint | Not yet answered correctly Number of responses between 579.5 and 599.5: "Your answer must exactly equal the correct value.) Check answer Hint | Not yet answered correctly Number of responses between 599.5 and 619.5: (Your answer must exactly equal the correct value. Check answer | | Hint | Not yet answered correctly Number of responses between 619.5 and 639.5. Your answer must exactly equal the correct value.) Check answer | | Hint| Not yet answered correctly Number of responses between 639.5 and 659.5: (Your answer must exactly equal the correct value. Check answer | Hint | Not yet answered correctly Number of responses between 659.5 and 679.5: (Your answer must exactly equal the correct value.) Check answer | | Hint|Not yet answered correcth Number of responses between 679.5 and 699.5: (Your answer must exactly equal the correct value. Check answer| | Hint | Not yet answered correctly Number of responses between 699.5 and 719.5: (Your answer must exactly equal the correct value.) Check answer| |Hint| Not yet answered correctly Number of responses between 719.5 and 739.5: Your answer must exactly equal the correct value. Check answer|Hint |Not yet answered correctly Number of responses between 739.5 and 759.5: (Your answer must exactly equal the correct value. Check answer| |Hint| Not yet answered correct Number of responses between 759.5 and 779.5: (Your answer must exactly equal the correct value.) Check answer| |Hint | Not yet answered correctly Number of responses between 779.5 and 799.5: (Your answer must exactly equal the correct value.) Check answer| |Hint| Not yet answered correct Number of responses between 799.5 and 819.5: Your answer must exactly equal the correct value.) Check answer| |Hint | Not yet answered correctly Number of responses between $19.5 and 839.5: (Your answer must exactly equal the correct value.) Check answer| |Hint|Not yet answered correcth Number of responses between 839.5 and 859.5: Your answer must exactly equal the correct value.) Check answer| |Hint | Not yet answered correctlyYour trial-by-trial data On each trial, your task was to respond as soon as you saw a green circle. Each row below indicates the time between the appearance of the green circle and your response. Reaction time (ms) Trial 645.0 815.0 389.0 aWN 106.0 598.0 269.0 385.0 546.0 379.0 355.0 327.0 299.0 284.0 381.0 334.0 417.0 305.0 370.0 389.0 337. 377.0 358.0 346. 320.0 317.0 582.0 295.0 332.0 406.0 512.0 453.0 335.0 335.0 443.0 373.0 380.0 365.0 438.0 322.0 513.0 389.0 364.0 411. 344.0 437.0 361.0
Step by Step Solution
There are 3 Steps involved in it

Get step-by-step solutions from verified subject matter experts