

Question: Please help statistics problems Below are the box plots for the variables for the breakfast cereals. Box plot of carbohydrates 60 Box plot of fiber
Please help statistics problems
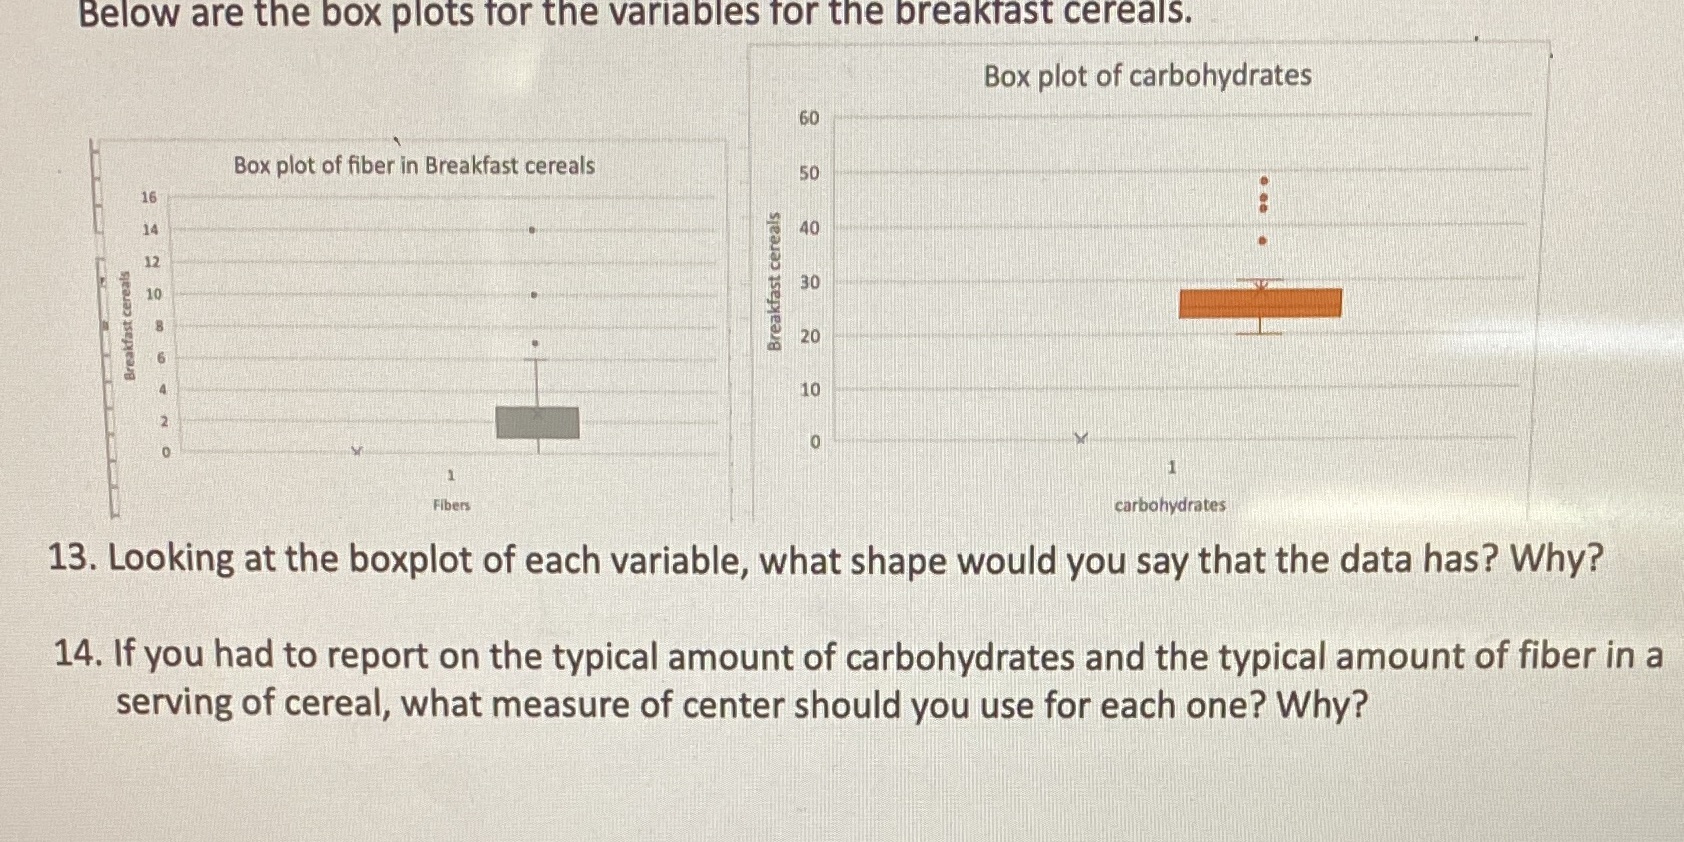
Below are the box plots for the variables for the breakfast cereals. Box plot of carbohydrates 60 Box plot of fiber in Breakfast cereals 50 16 14 40 12 Breakfast cereals 30 10 Breakfast cereal 20 10 Fibers carbohydrates 13. Looking at the boxplot of each variable, what shape would you say that the data has? Why? 14. If you had to report on the typical amount of carbohydrates and the typical amount of fiber in a serving of cereal, what measure of center should you use for each one? Why
Step by Step Solution
There are 3 Steps involved in it
1 Expert Approved Answer
Step: 1 Unlock

Question Has Been Solved by an Expert!
Get step-by-step solutions from verified subject matter experts
Step: 2 Unlock
Step: 3 Unlock