

Question: please help Table 3 contains the experimental data for the 2.0 mL micro-scale fractional distillation. of a mixture of hydrocarbons. Reference: Instructions for Plotting Fractional
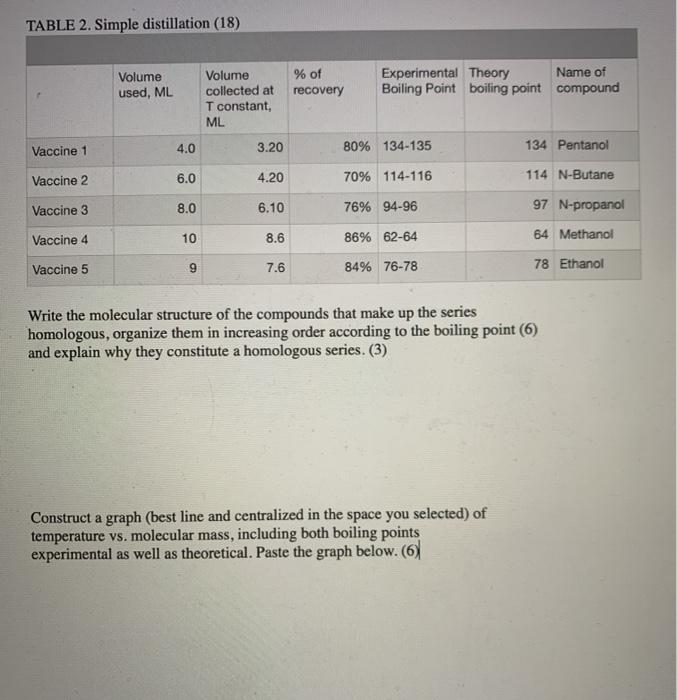
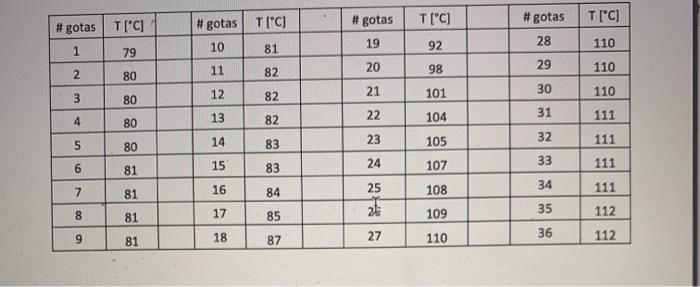
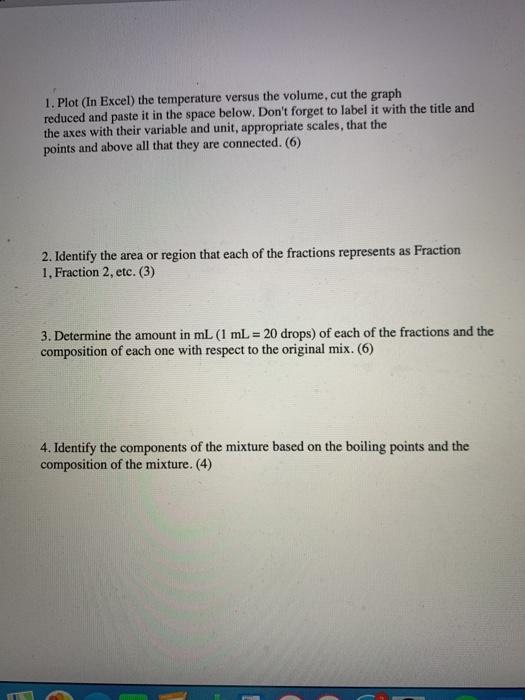
TABLE 2. Simple distillation (18) Volume used, ML % of recovery Experimental Theory Name of Boiling Point boiling point compound Volume collected at T constant, ML Vaccine 1 4.0 3.20 80% 134-135 134 Pentanol Vaccine 2 6.0 4.20 70% 114-116 114 N-Butane Vaccine 3 8.0 6.10 76% 94-96 97 N-propanol Vaccine 4 10 8.6 86% 62-64 84 Methanol Vaccine 5 9 7.6 84% 76-78 78 Ethanol Write the molecular structure of the compounds that make up the series homologous, organize them in increasing order according to the boiling point (6) and explain why they constitute a homologous series. (3) Construct a graph (best line and centralized in the space you selected) of temperature vs. molecular mass, including both boiling points experimental as well as theoretical. Paste the graph below. (6) # gotas T["C] T[C] #gotas #gotas T["C] T[C] 19 #gotas 28 29 10 1 110 92 79 81 20 2 11 98 80 82 110 12 21 3 30 101 110 80 82 13 22 4 31 82 80 104 111 23 32 5 14 80 111 105 15 24 33 LO 83 83 84 81 107 111 7 16 25 34 81 108 111 8 17 81 85 35 109 112 9 18 81 36 87 27 110 112 1. Plot (In Excel) the temperature versus the volume, cut the graph reduced and paste it in the space below. Don't forget to label it with the title and the axes with their variable and unit, appropriate scales, that the points and above all that they are connected. (6) 2. Identify the area or region that each of the fractions represents as Fraction 1. Fraction 2, etc. (3) 3. Determine the amount in mL (1 mL = 20 drops) of each of the fractions and the composition of each one with respect to the original mix. (6) 4. Identify the components of the mixture based on the boiling points and the composition of the mixture.(4)
Step by Step Solution
There are 3 Steps involved in it

Get step-by-step solutions from verified subject matter experts