

Question: Please help, Thank you!! 2) The Excel sheet Treasury Yield Curve has treasury yield curve data that is required to solve this problem. Note that
 Please help, Thank you!!
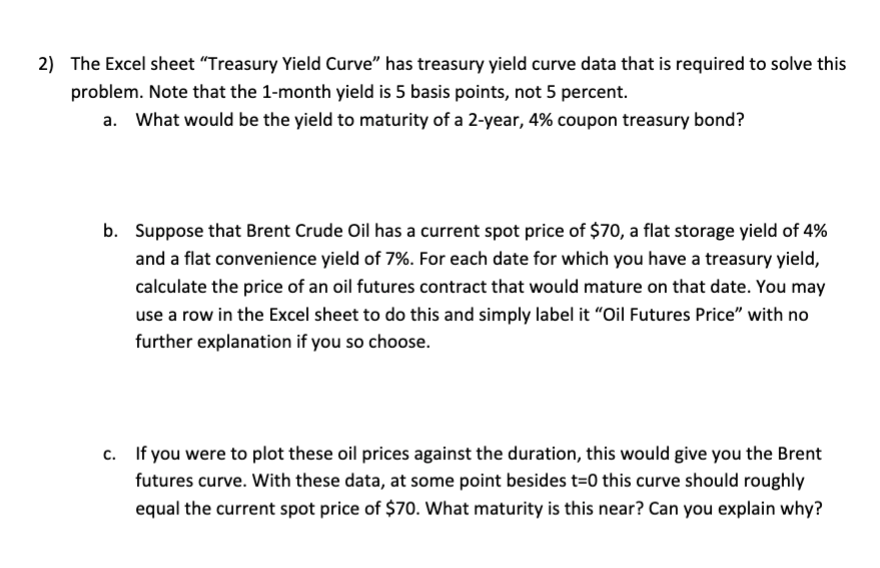
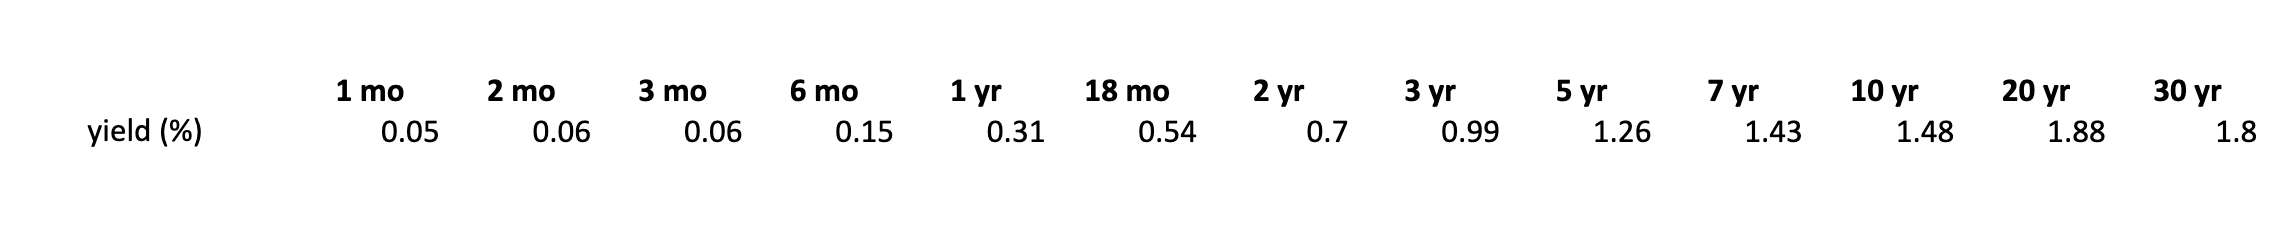
2) The Excel sheet Treasury Yield Curve has treasury yield curve data that is required to solve this problem. Note that the 1-month yield is 5 basis points, not 5 percent. a. What would be the yield to maturity of a 2-year, 4% coupon treasury bond? b. Suppose that Brent Crude Oil has a current spot price of $70, a flat storage yield of 4% and a flat convenience yield of 7%. For each date for which you have a treasury yield, calculate the price of an oil futures contract that would mature on that date. You may use a row in the Excel sheet to do this and simply label it "Oil Futures Price" with no further explanation if you so choose. C. If you were to plot these oil prices against the duration, this would give you the Brent futures curve. With these data, at some point besides t=0 this curve should roughly equal the current spot price of $70. What maturity is this near? Can you explain why? 2 mo 1 yr 2 yr 3 yr 5 yr 7 yr 10 yr 20 yr 30 yr 1 mo 0.05 3 mo 0.06 6 mo 0.15 18 mo 0.54 yield (%) 0.06 0.31 0.7 0.99 1.26 1.43 1.48 1.88 1.8 2) The Excel sheet Treasury Yield Curve has treasury yield curve data that is required to solve this problem. Note that the 1-month yield is 5 basis points, not 5 percent. a. What would be the yield to maturity of a 2-year, 4% coupon treasury bond? b. Suppose that Brent Crude Oil has a current spot price of $70, a flat storage yield of 4% and a flat convenience yield of 7%. For each date for which you have a treasury yield, calculate the price of an oil futures contract that would mature on that date. You may use a row in the Excel sheet to do this and simply label it "Oil Futures Price" with no further explanation if you so choose. C. If you were to plot these oil prices against the duration, this would give you the Brent futures curve. With these data, at some point besides t=0 this curve should roughly equal the current spot price of $70. What maturity is this near? Can you explain why? 2 mo 1 yr 2 yr 3 yr 5 yr 7 yr 10 yr 20 yr 30 yr 1 mo 0.05 3 mo 0.06 6 mo 0.15 18 mo 0.54 yield (%) 0.06 0.31 0.7 0.99 1.26 1.43 1.48 1.88 1.8
Step by Step Solution
There are 3 Steps involved in it

Get step-by-step solutions from verified subject matter experts