

Question: PLEASE HELP!!! Thank you!!! :) I have attached an image including 5 questions below. I apologize for the questions being out of order. 2. Provide
PLEASE HELP!!! Thank you!!! :)
I have attached an image including 5 questions below. I apologize for the questions being out of order.

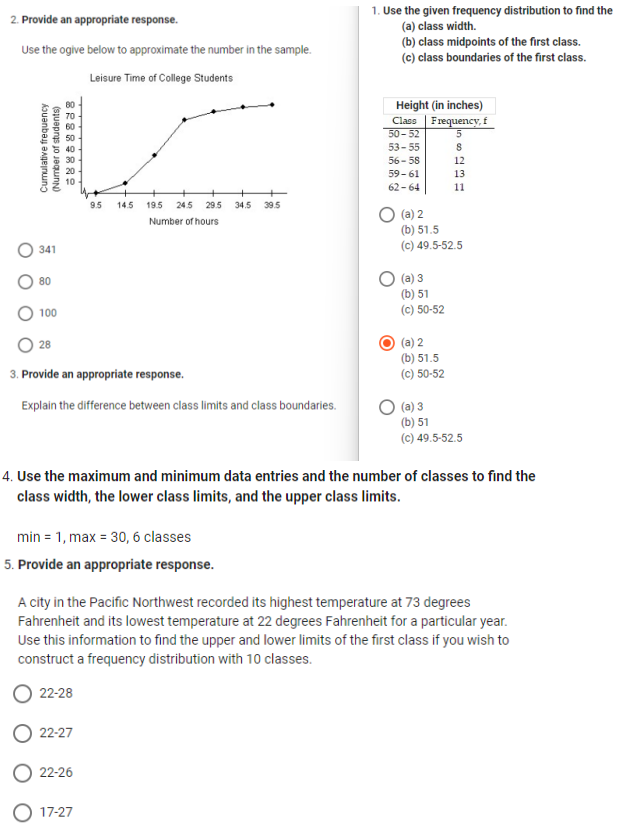
2. Provide an appropriate response. 1. Use the given frequency distribution to find the (a) class width. Use the ogive below to approximate the number in the sample. (b) class midpoints of the first class. (c) class boundaries of the first class. Leisure Time of College Students Height (in inches) Class Frequency, f 50-52 5 68869838 Cumulative frequency (Number of students) 53-55 8 56-58 12 59 - 61 13 62-64 11 9.5 14.5 195 24.5 295 34.5 39.5 Number of hours (a) 2 (b) 51.5 O 341 (c) 49.5-52.5 O 80 O (a) 3 (b) 51 100 (c) 50-52 28 O (a) 2 (b) 51.5 3. Provide an appropriate response. (c) 50-52 Explain the difference between class limits and class boundaries. O (a) 3 (b) 51 (c) 49.5-52.5 4. Use the maximum and minimum data entries and the number of classes to find the class width, the lower class limits, and the upper class limits. min = 1, max = 30, 6 classes 5. Provide an appropriate response. A city in the Pacific Northwest recorded its highest temperature at 73 degrees Fahrenheit and its lowest temperature at 22 degrees Fahrenheit for a particular year. Use this information to find the upper and lower limits of the first class if you wish to construct a frequency distribution with 10 classes. 22-28 22-27 22-26 17-27
Step by Step Solution
There are 3 Steps involved in it

Get step-by-step solutions from verified subject matter experts