

Question: please help, thank you so much Pack C01.04.pdf 19 1. The past returns on asset A and Asset B are tabulated as follow: Year Return
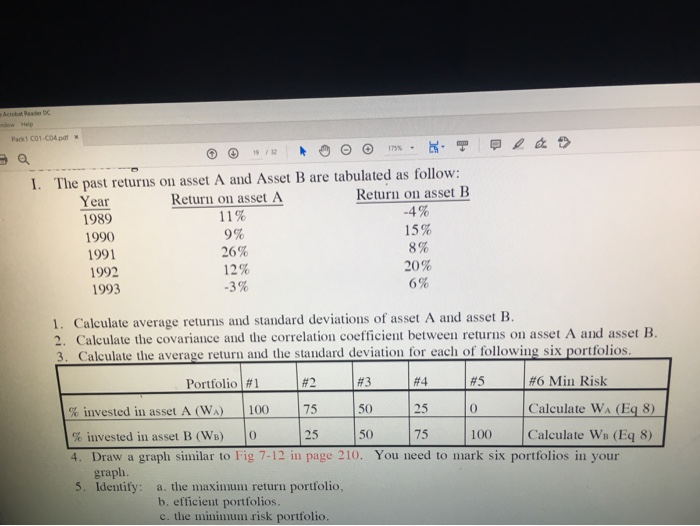
Pack C01.04.pdf 19 1. The past returns on asset A and Asset B are tabulated as follow: Year Return on asset A Return on asset B 1989 11% -4% 1990 15% 1991 26% 8% 1992 12% 20% 1993 -3% 6% 9% 1. Calculate average returns and standard deviations of asset A and asset B. 2. Calculate the covariance and the correlation coefficient between returns on asset A and asset B. 3. Calculate the average return and the standard deviation for each of following six portfolios. #2 #3 Portfolio #1 #4 #5 #6 Min Risk % invested in asset A (WA) 100 75 50 25 0 Calculate WA (Eq8) % invested in asset B (WB) 0 25 50 75 100 Calculate Ws (Eq 8) 4. Draw a graph similar to Fig 7-12 in page 210. You need to mark six portfolios in your graph. 5. Identify: a. the maximum return portfolio, b. efficient portfolios. c. the minimum risk portfolio
Step by Step Solution
There are 3 Steps involved in it

Get step-by-step solutions from verified subject matter experts