

Question: please help... the cells that I highlighted is the work I've done, but I'm not even sure I've done this properly and I have no
please help... the cells that I highlighted is the work I've done, but I'm not even sure I've done this properly and I have no idea what to do. this is the spreadsheet that I must work with (please show excel formulas used)
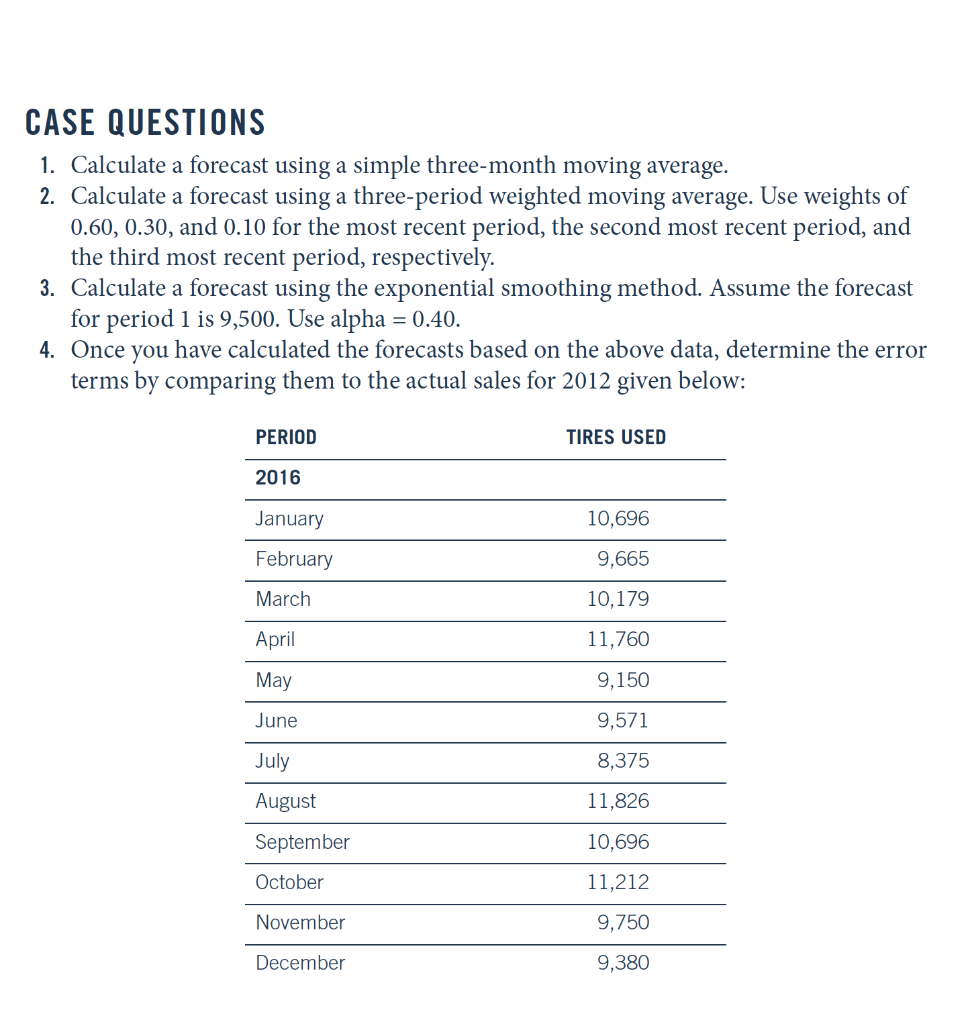
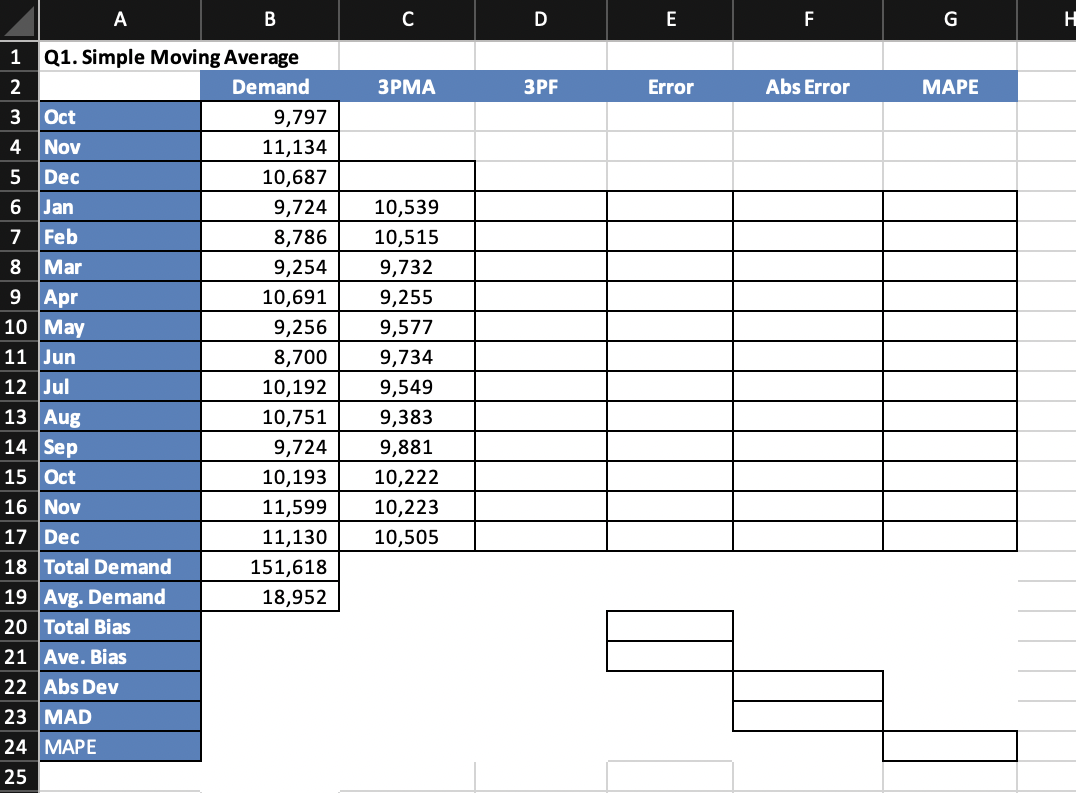
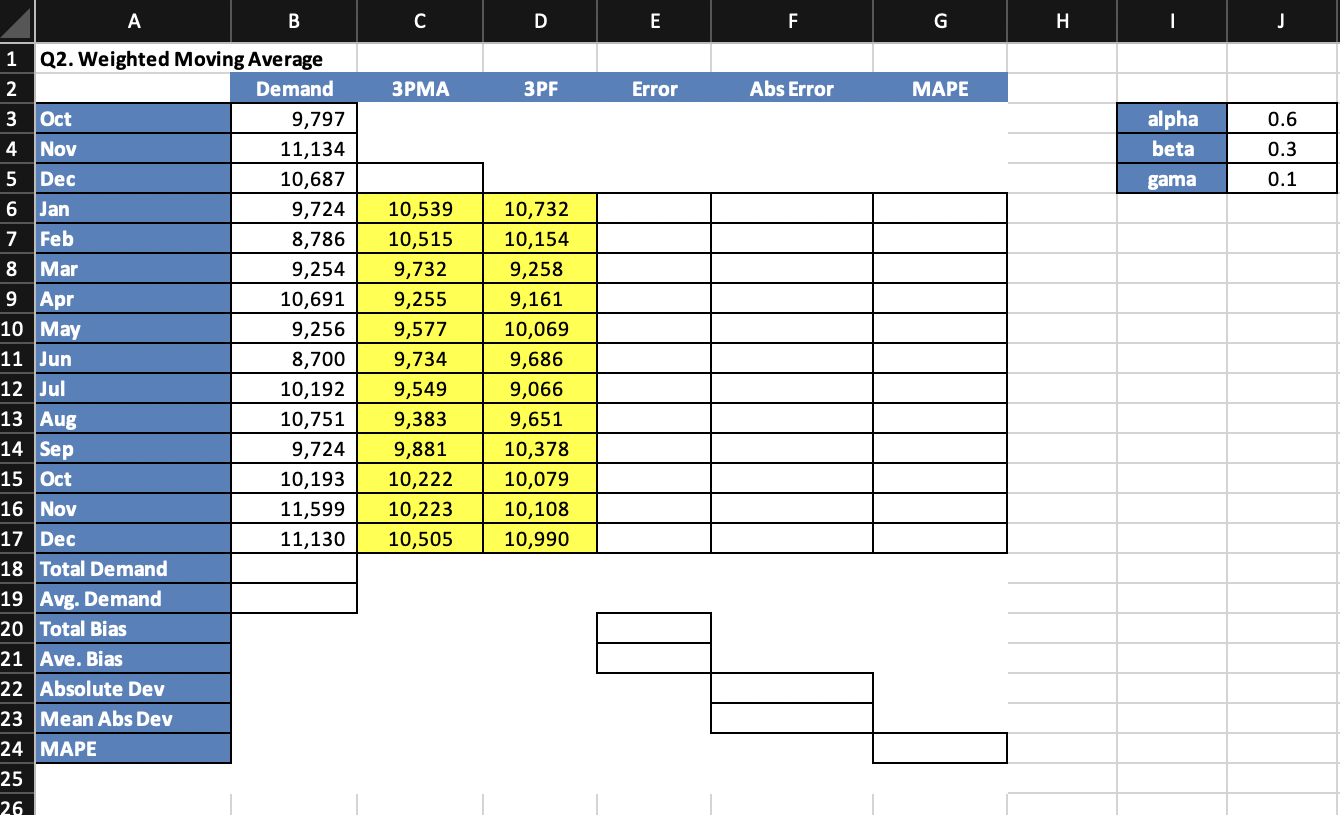
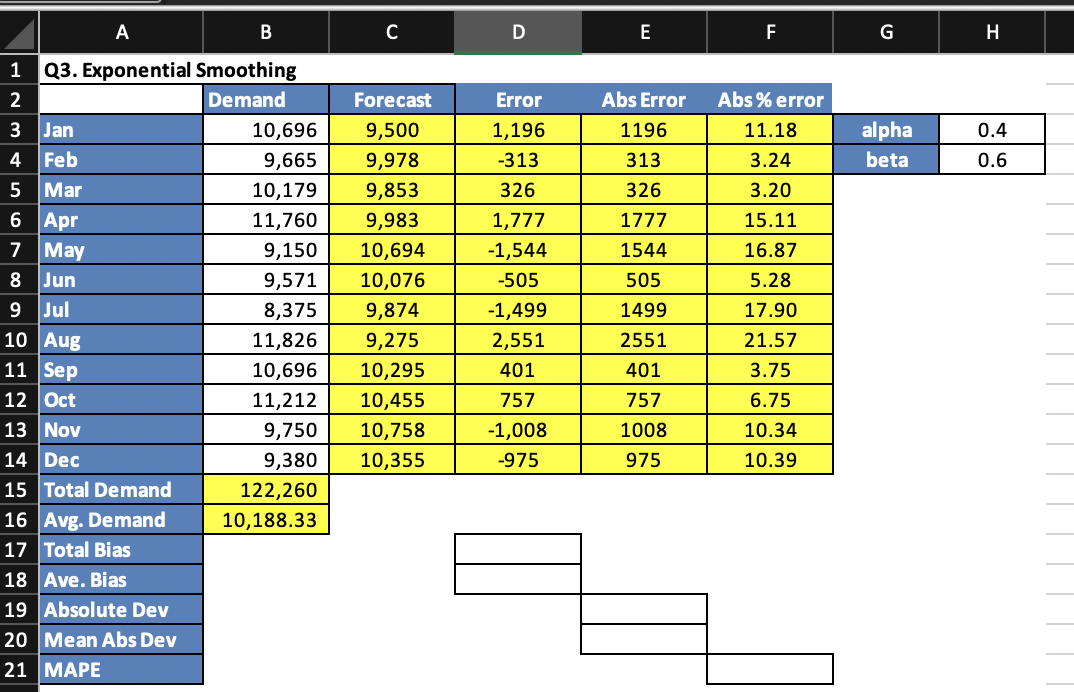
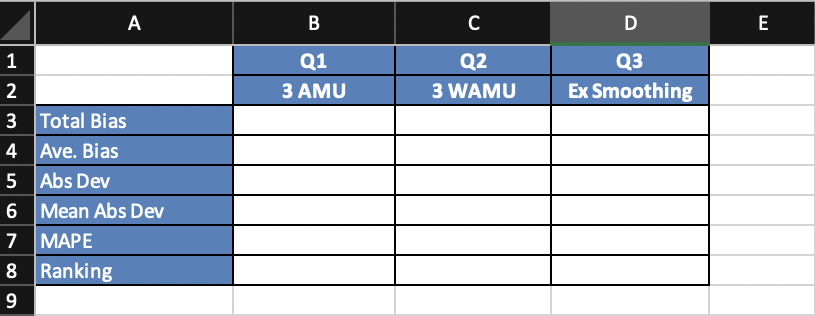
CASE QUESTIONS 1. Calculate a forecast using a simple three-month moving average. 2. Calculate a forecast using a three-period weighted moving average. Use weights of 0.60, 0.30, and 0.10 for the most recent period, the second most recent period, and the third most recent period, respectively. 3. Calculate a forecast using the exponential smoothing method. Assume the forecast for period 1 is 9,500. Use alpha = 0.40. 4. Once you have calculated the forecasts based on the above data, determine the error terms by comparing them to the actual sales for 2012 given below: PERIOD TIRES USED 2016 January 10,696 February 9,665 March 10,179 April 11,760 May 9,150 June 9,571 July 8,375 August 11,826 September 10,696 October 11,212 November 9,750 December 9,380 A B D E F G H 3PF Error Abs Error MAPE 000wN Dec 1 Q1. Simple Moving Average 2 Demand 3 Oct 9,797 4 Nov 11,134 5 10,687 6 Jan 9,724 7 Feb 8,786 8 Mar 9,254 9 Apr 10,691 10 May 9,256 11 Jun 8,700 12 Jul 10,192 13 Aug 10,751 14 Sep 9,724 15 Oct 10,193 16 Nov 11,599 17 Dec 11,130 18 Total Demand 151,618 19 Avg. Demand 18,952 20 Total Bias 21 Ave. Bias 22 Abs Dev 23 MAD 24 MAPE 25 10,539 10,515 9,732 9,255 9,577 9,734 9,549 9,383 9,881 10,222 10,223 10,505 A B C D E F G H I J 3PMA 3PF Error Abs Error MAPE 0.6 alpha beta 0.3 gama 0.1 9 Apr 1 Q2. Weighted Moving Average 2 Demand 3 Oct 9,797 4 Nov 11,134 5 Dec 10,687 6 Jan 9,724 7 Feb 8,786 8 Mar 9,254 10,691 10 May 9,256 11 Jun 8,700 12 Jul 10,192 13 Aug 10,751 9,724 15 Oct 10,193 16 Nov 11,599 17 Dec 11,130 18 Total Demand 19 Avg. Demand 20 Total Bias 21 Ave. Bias 22 Absolute Dev 23 Mean Abs Dev 24 MAPE 25 10,539 10,515 9,732 9,255 9,577 9,734 9,549 9,383 9,881 10,222 10,223 10,505 10,732 10,154 9,258 9,161 10,069 9,686 9,066 9,651 10,378 10,079 10,108 10,990 14 Sep 26 A C D E F G Error 0.4 Abs Error 1196 313 326 Abs% error 11.18 3.24 3.20 15.11 alpha beta 0.6 6 Apr 1777 1544 Forecast 9,500 9,978 9,853 9,983 10,694 10,076 9,874 9,275 10,295 10,455 10,758 10,355 16.87 5.28 505 1 Q3. Exponential Smoothing 2 Demand 3 Jan 10,696 4 Feb 9,665 5 Mar 10,179 11,760 7 May 9,150 8 Jun 9,571 9 Jul 8,375 10 Aug 11,826 11 Sep 10,696 12 Oct 11,212 13 Nov 9,750 14 Dec 9,380 15 Total Demand 122,260 16 Avg. Demand 10,188.33 17 Total Bias 18 Ave. Bias 19 Absolute Dev 20 Mean Abs Dev 21 MAPE 1,196 -313 326 1,777 -1,544 -505 -1,499 2,551 401 757 -1,008 -975 17.90 1499 2551 401 21.57 3.75 6.75 10.34 757 1008 975 10.39 A B D E 1 Q1 3 AMU Q2 WAMU Q3 Ex Smoothing wN 2 3 Total Bias 4 Ave. Bias 5 Abs Dev 6 Mean Abs Dev 7 MAPE 8 Ranking 9Step by Step Solution
There are 3 Steps involved in it
1 Expert Approved Answer
Step: 1 Unlock

Question Has Been Solved by an Expert!
Get step-by-step solutions from verified subject matter experts
Step: 2 Unlock
Step: 3 Unlock