

Question: Please help: The contour plot for a function f(a:, y) is given below. 1/ 0 0.5 1 1.5 2 2.5 3 (a) _) Explain (with
Please help:
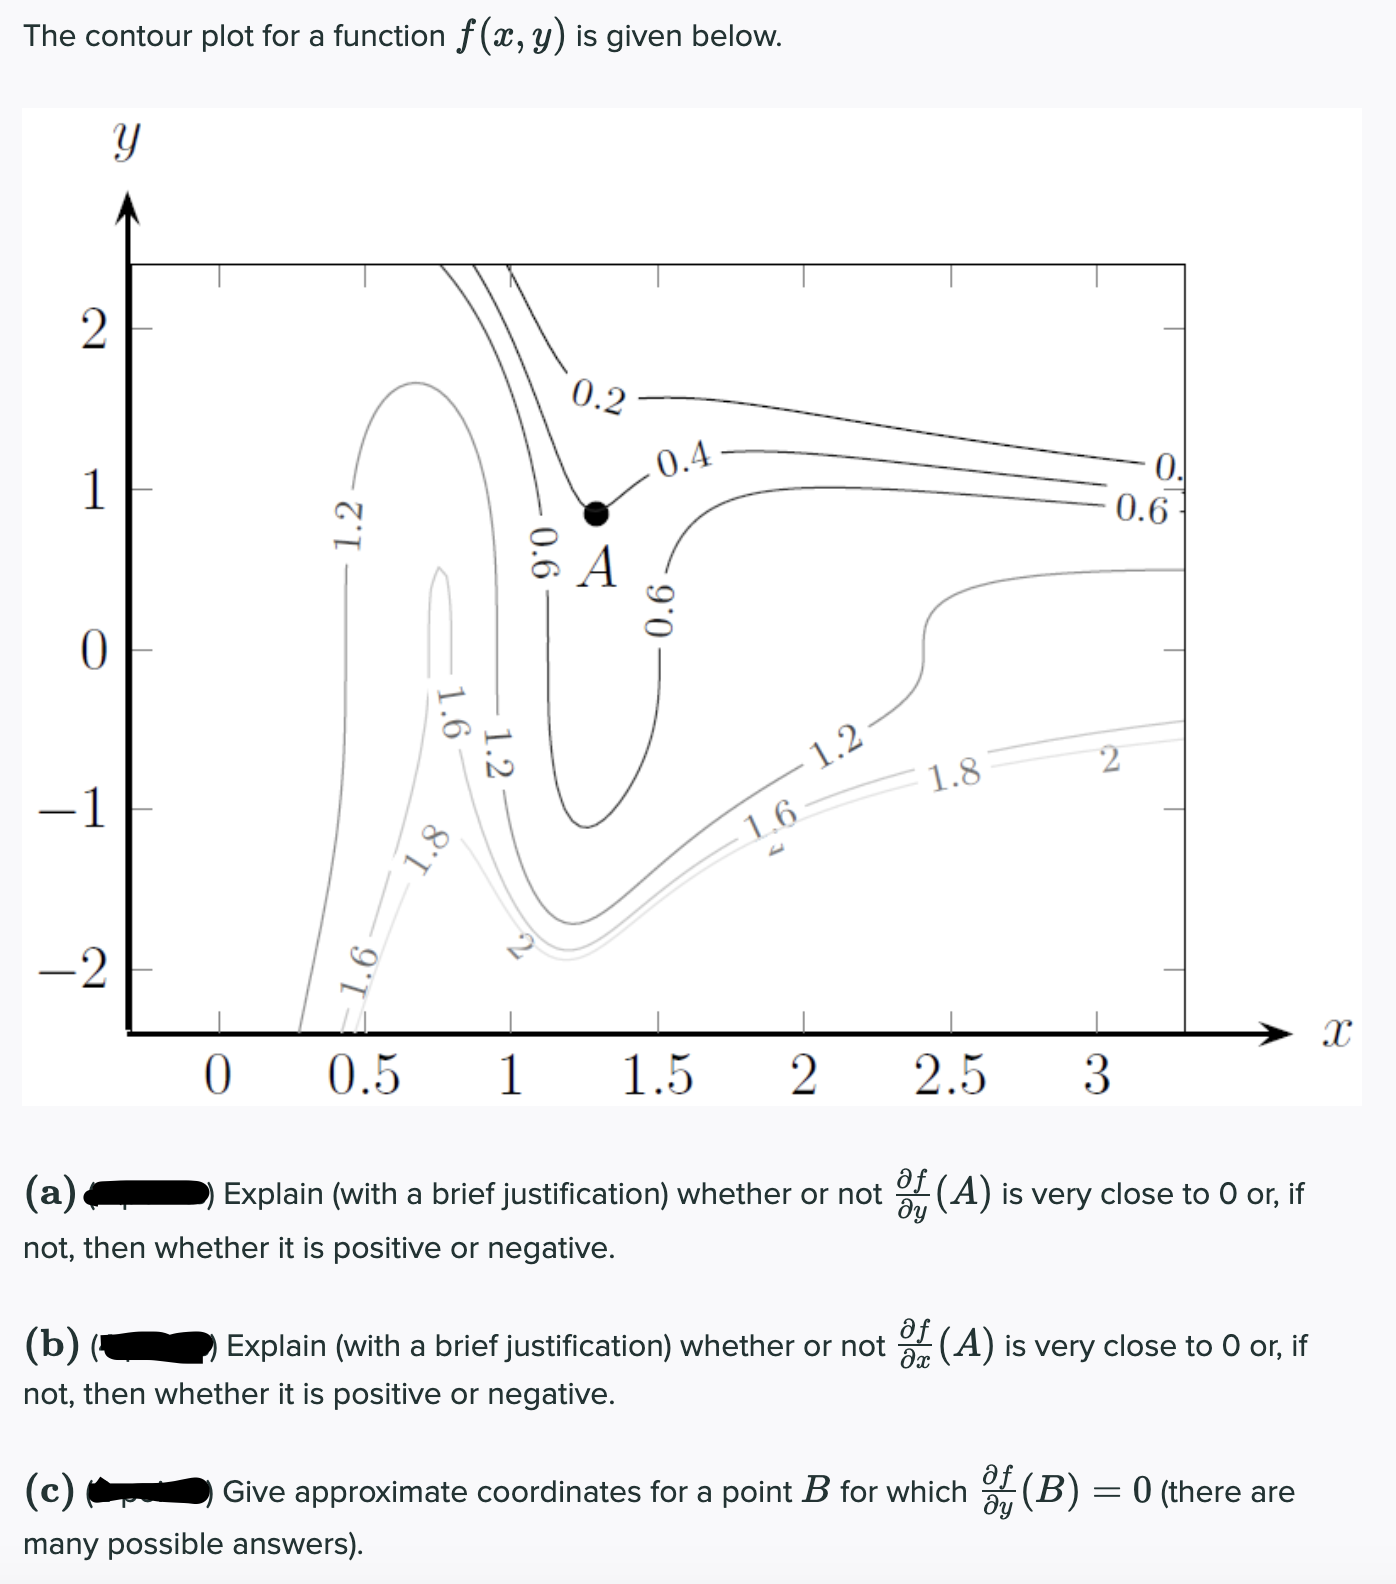
The contour plot for a function f(a:, y) is given below. 1/ 0 0.5 1 1.5 2 2.5 3 (a) _) Explain (with a briefjustification) whether or not %(A) is very close to O or, if not, then whether it is positive or negative. (b) (. Explain (with a briefjustification) whether or not 3% (A) is very close to O or, if not, then whether it is positive or negative. (0) _ Give approximate coordinates for a point B for which %(B) = 0 (there are many possible answers)
Step by Step Solution
There are 3 Steps involved in it
1 Expert Approved Answer
Step: 1 Unlock

Question Has Been Solved by an Expert!
Get step-by-step solutions from verified subject matter experts
Step: 2 Unlock
Step: 3 Unlock