

Question: please help The data in the accompanying table represent the population of a certain country every 10 years for the years 1900-2000. An ecologist is
please help
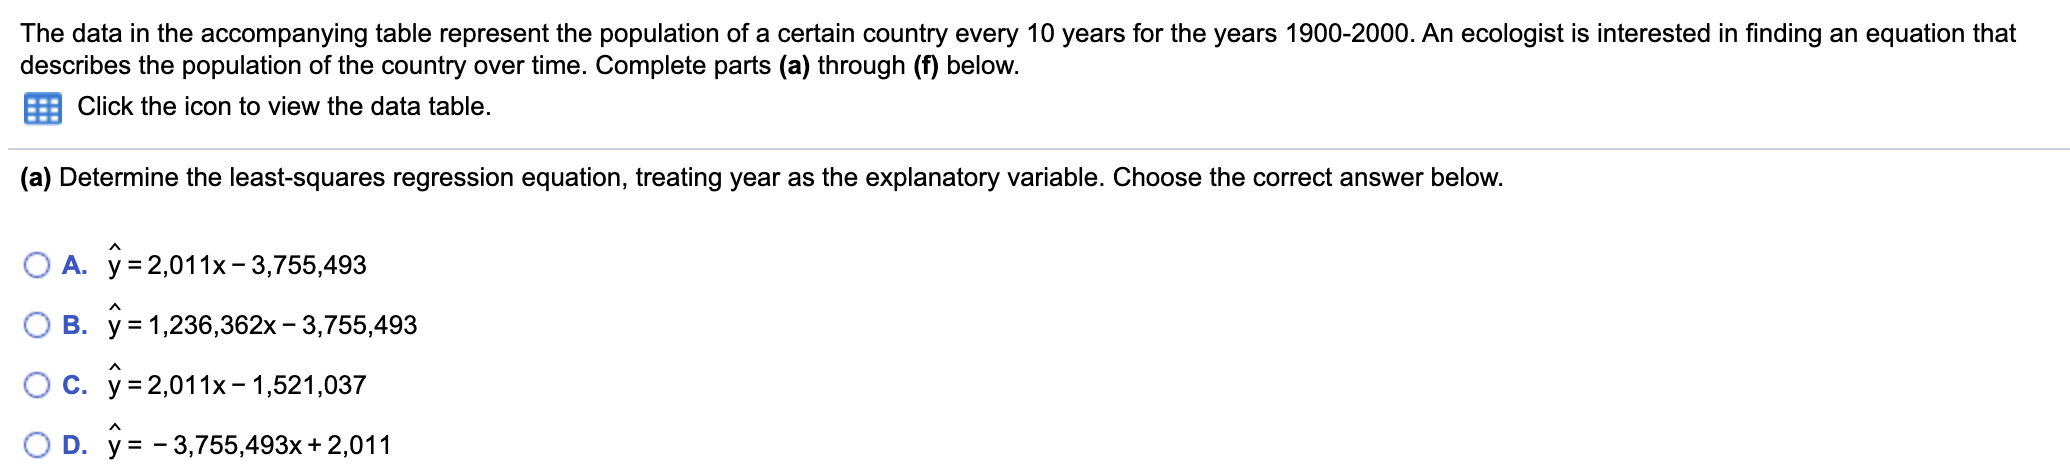
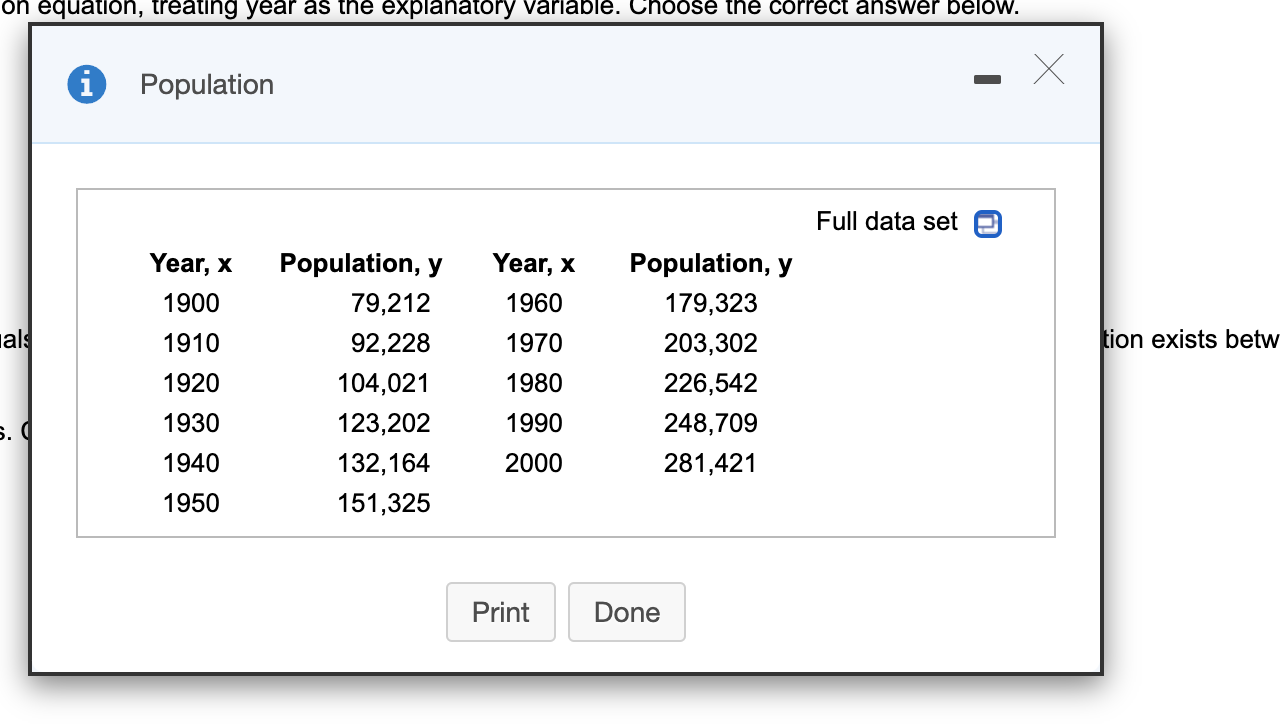
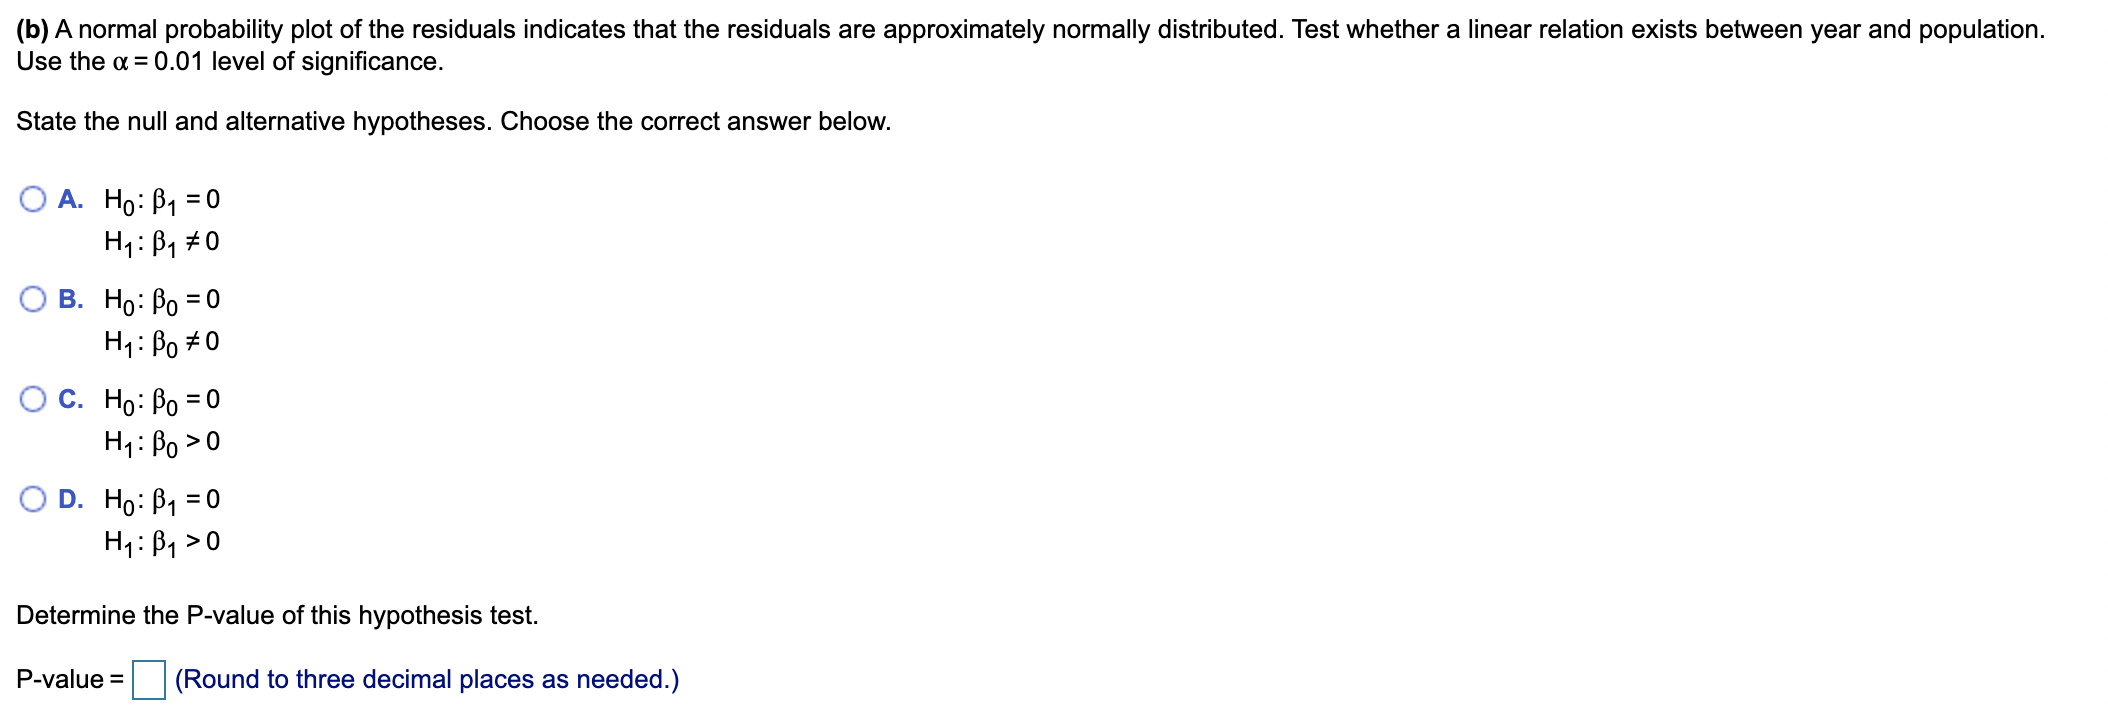
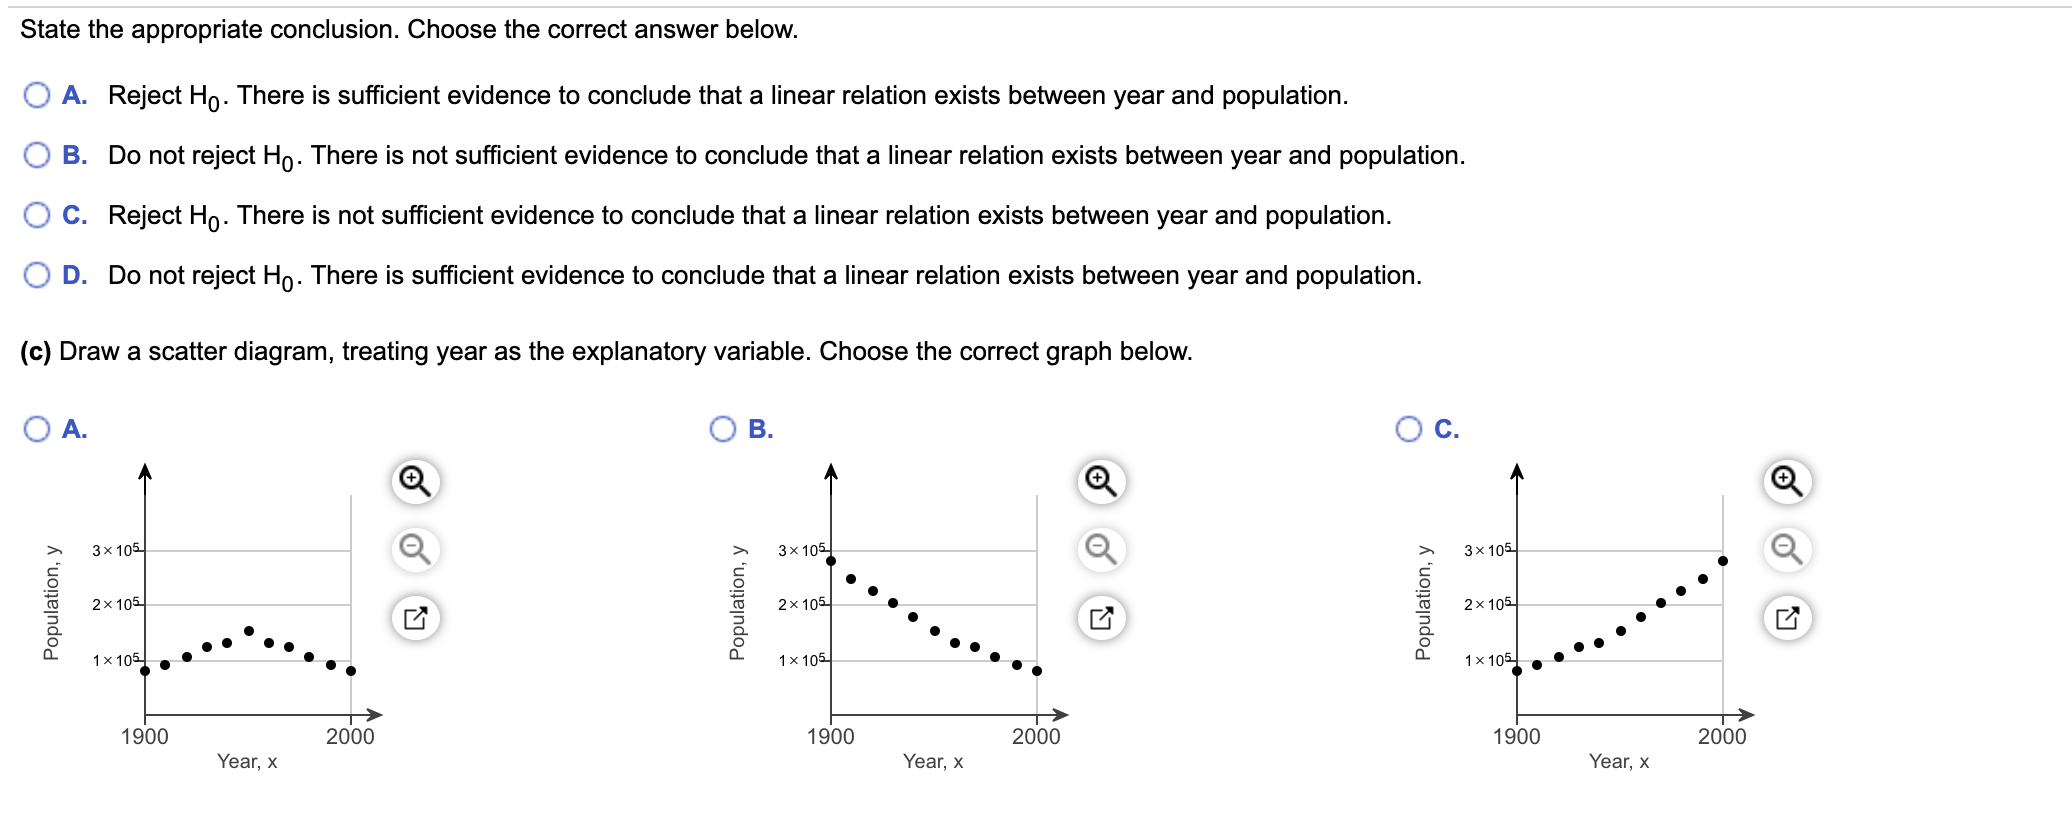
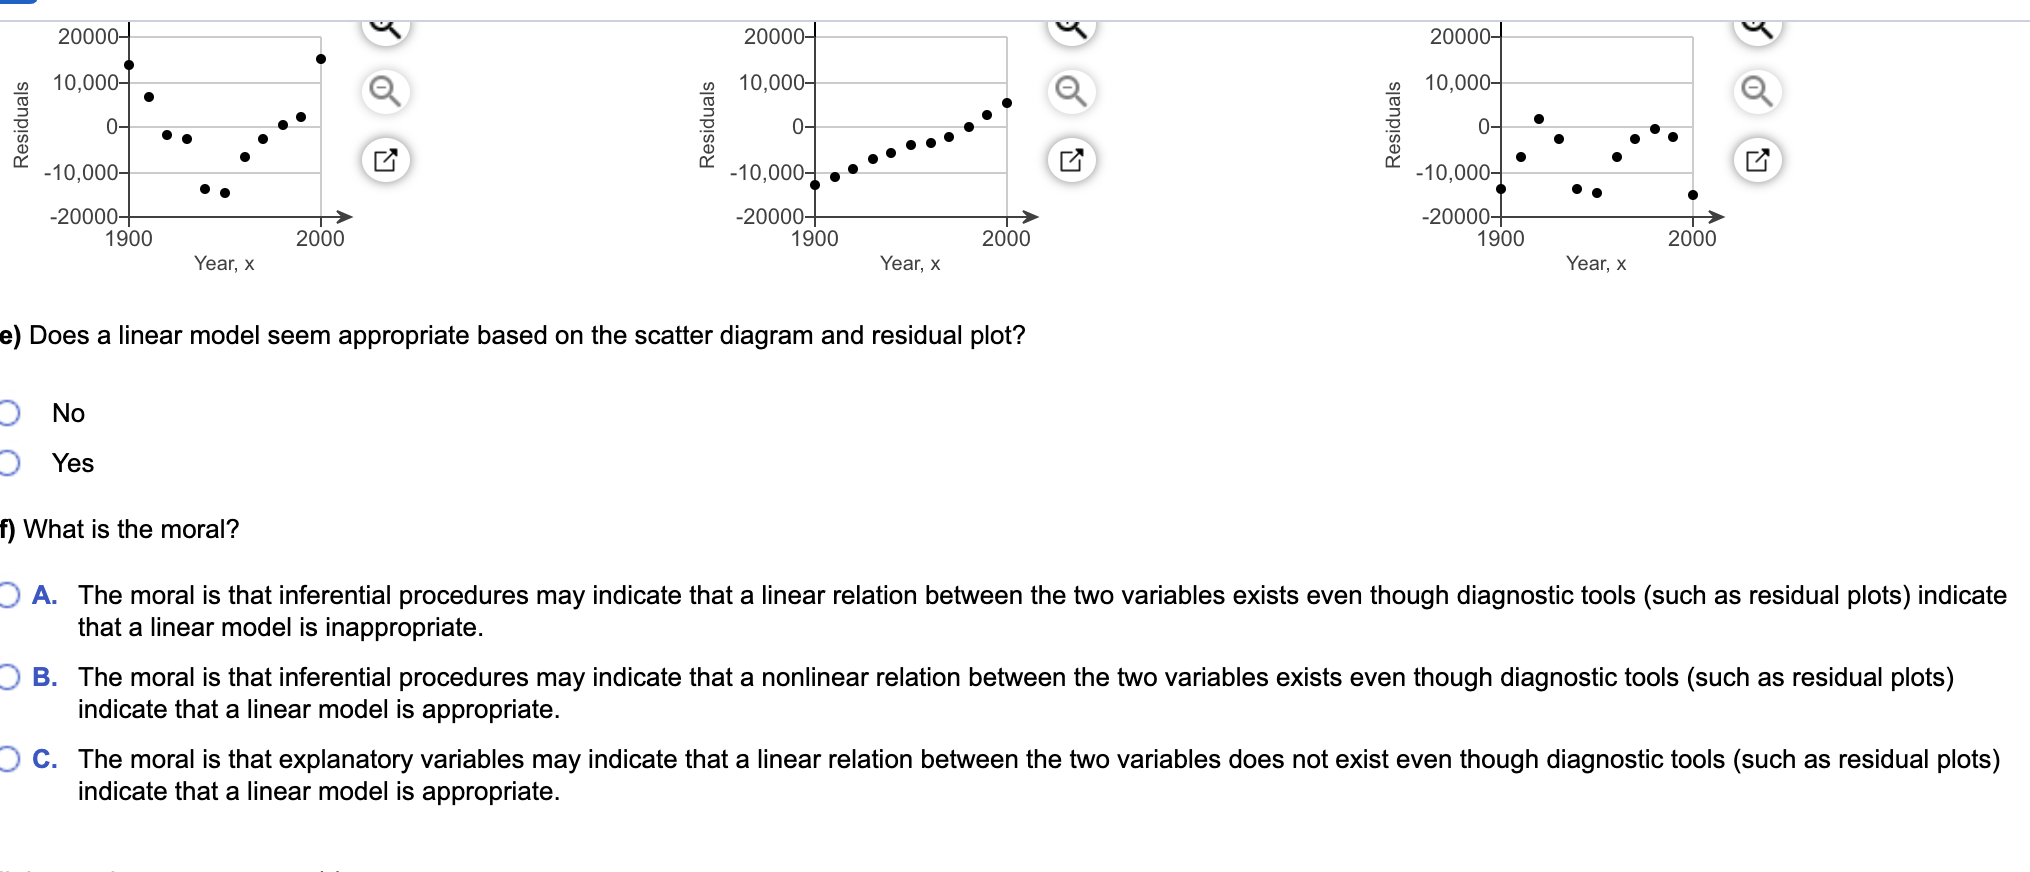
The data in the accompanying table represent the population of a certain country every 10 years for the years 1900-2000. An ecologist is interested in finding an equation that describes the population of the country over time. Complete parts (a) through (f) below. Click the icon to view the data table. (a) Determine the least-squares regression equation, treating year as the explanatory variable. Choose the correct answer below. O A. y= 2,011x - 3,755,493 O B. y= 1,236,362x - 3,755,493 O c. y= 2,011x - 1,521,037 O D. y= - 3,755,493x + 2,011on equation, treating year as the explanatory variable. Choose the correct answer below. Population X Full data set O Year, X Population, y Year, X Population, y 1900 79,212 1960 179,323 als 1910 92,228 1970 203,302 tion exists betw 1920 104,021 1980 226,542 1930 123,202 1990 248,709 1940 132, 164 2000 281,421 1950 151,325 Print Done(b) A normal probability plot of the residuals indicates that the residuals are approximately normally distributed. Test whether a linear relation exists between year and population. Use the (x = 0.01 level of signicance. State the null and alternative hypotheses. Choose the correct answer below. 0 A. Ho: [51 =0 H1 : [i1 0 O B. Ho:o=0 H1:Bo0 O c. Ho:po=o H13o>0 O D. Hoz1=0 H1551>O Determine the P-value of this hypothesis test. P-value = I: (Round to three decimal places as needed.) State the appropriate conclusion. Choose the correct answer below. O A. Reject Ho. There is sufficient evidence to conclude that a linear relation exists between year and population. O B. Do not reject Ho. There is not sufficient evidence to conclude that a linear relation exists between year and population. O C. Reject Ho. There is not sufficient evidence to conclude that a linear relation exists between year and population. O D. Do not reject Ho. There is sufficient evidence to conclude that a linear relation exists between year and population. (c) Draw a scatter diagram, treating year as the explanatory variable. Choose the correct graph below. O A. O B. O c. 3 x 10⁵ 3 x 10⁵ 3 x 10⁵ Population, y 2 x 10⁵ Population, y 2x 10⁵ Population, y 2 x 10⁵ . . . . 1 x 10⁵ 1 x 10⁵ 1 x 10⁵ . 1900 2000 1900 2000 Year, X 1900 2000 Year, x Year, X20000 "'\\ 20000 W 20000 K O m 10000 (I) 10000 I: 10000 _ . _ _ g 0 . O Q g 0 - - I Q g 0 ' Q a 0 I I 'a I a I I ' I 22 - 1;. it . - ' ' B - - E -10 000 -10,000 g ' -10 000 1900 2000 1900 2000 1900 2000 Year, x Year, x Year, x 9) Does a linear model seem appropriate based on the scatter diagram and residual plot? 3 No D Yes f) What is the moral? D A. The moral is that inferential procedures may indicate that a linear relation between the two variables exists even though diagnostic tools (such as residual plots) indicate that a linear model is inappropriate. C) B. The moral is that inferential procedures may indicate that a nonlinear relation between the two variables exists even though diagnostic tools (such as residual plots) indicate that a linear model is appropriate. 3 C. The moral is that explanatory variables may indicate that a linear relation between the two variables does not exist even though diagnostic tools (such as residual plots) indicate that a linear model is appropriate
Step by Step Solution
There are 3 Steps involved in it

Get step-by-step solutions from verified subject matter experts