

Question: please help The data shown to the right represent the age (in weeks) at which babies rst crawl, based on a survey of 12 mothers.
please help
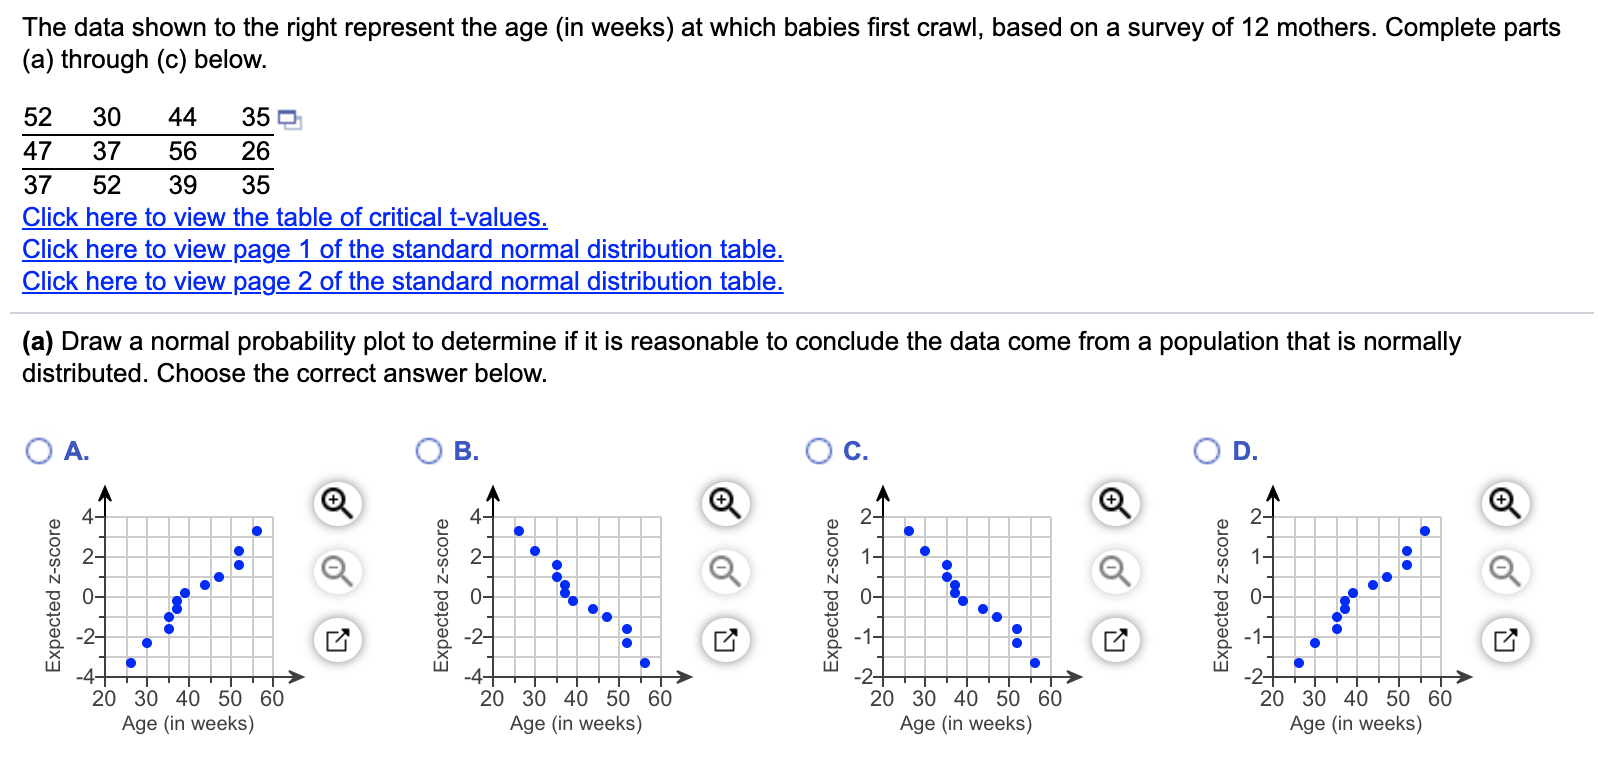
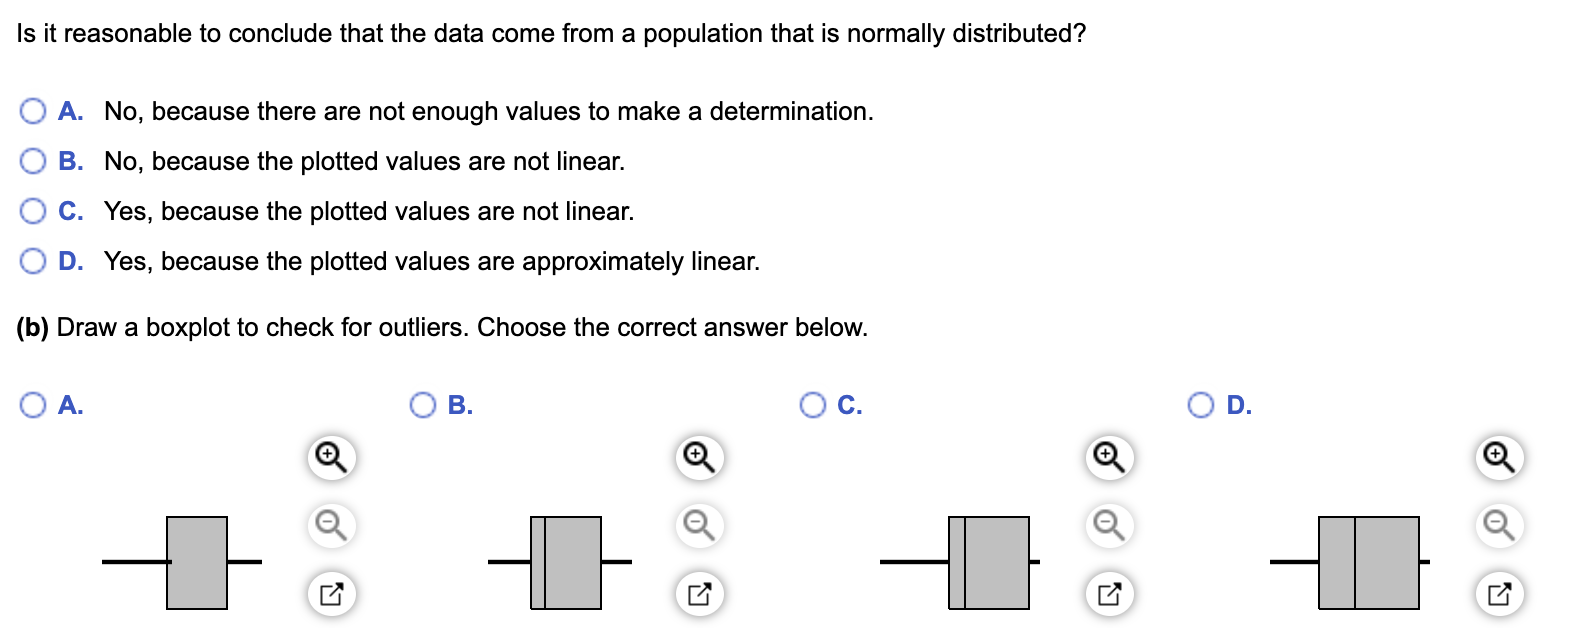
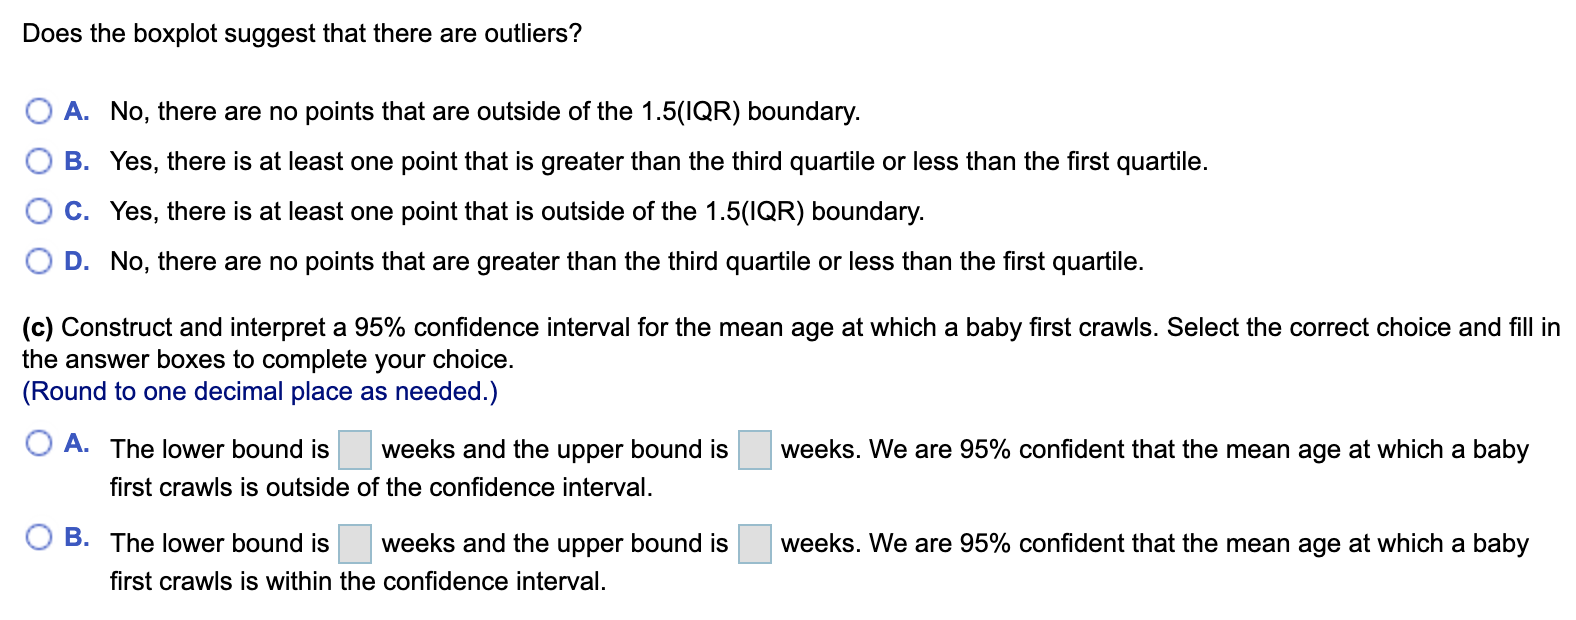
The data shown to the right represent the age (in weeks) at which babies rst crawl, based on a survey of 12 mothers. Complete parts (a) through (c) below. 52 30 44 35 :1: 47 37 56 26 37 52 39 35 Click here to View the table of critical tvalues. Click here to View @ge 1 of the standard normal distribution table. Click here to View @ge 2 of the standard normal distribution table. (a) Draw a normal probability plot to determine if it is reasonable to conclude the data come from a population that is normally distributed. Choose the correct answer below. OA OB. 0c OD 94 c Q 94 c Q 92 a Q 92 o Q 2 ' 2 ' 1 ' 1 ' rt .-' Q nu 3.. Q nu 3' Q a .-' Q E0 '- E0 .. E0 .. E0 '- -2 .' IZ' 34-2 : IZ' -1 : I3 24-1 .' I3 I.I.|_4 . I.I.|_4 I \"4.2 O l.|.|_2 I 20 30 40 50 60 20 30 4O 50 60 20 30 40 50 60 20 30 40 50 60 Age (in weeks) Age (in weeks) Age (in weeks) Age (in weeks) Is it reasonable to conclude that the data come from a population that is normally distributed? O A. No, because there are not enough values to make a determination. O B. No, because the plotted values are not linear. O C. Yes, because the plotted values are not linear. O D. Yes, because the plotted values are approximately linear. (b) Draw a boxplot to check for outliers. Choose the correct answer below. O A. O B. O C. O D. + + + +Does the boxplot suggest that there are outliers? O A. No, there are no points that are outside of the 1.5(IQR) boundary. O B. Yes, there is at least one point that is greater than the third quartile or less than the first quartile. O C. Yes, there is at least one point that is outside of the 1.5(IQR) boundary. O D. No, there are no points that are greater than the third quartile or less than the first quartile. (c) Construct and interpret a 95% confidence interval for the mean age at which a baby first crawls. Select the correct choice and fill in the answer boxes to complete your choice. (Round to one decimal place as needed.) O A. The lower bound is weeks and the upper bound is weeks. We are 95% confident that the mean age at which a baby first crawls is outside of the confidence interval. O B. The lower bound is weeks and the upper bound is weeks. We are 95% confident that the mean age at which a baby first crawls is within the confidence interval
Step by Step Solution
There are 3 Steps involved in it

Get step-by-step solutions from verified subject matter experts