

Question: Please help The following data represent selected information from the comparative income statement and balance sheet for Hot Rolled Corporation for the years ended December
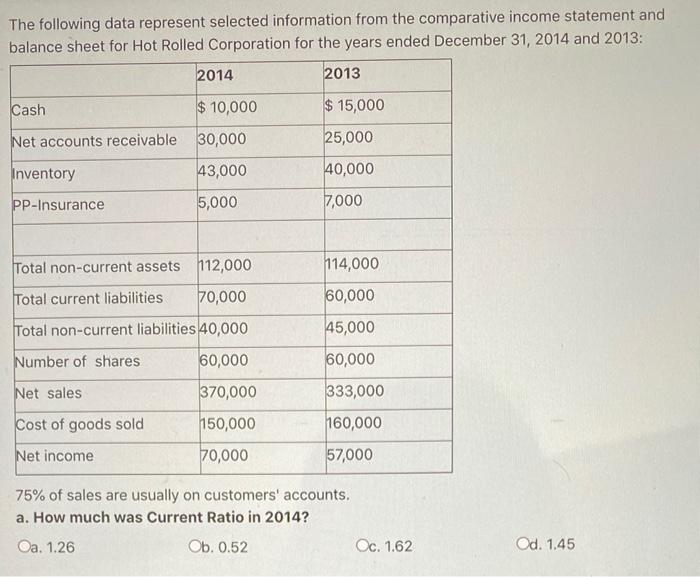
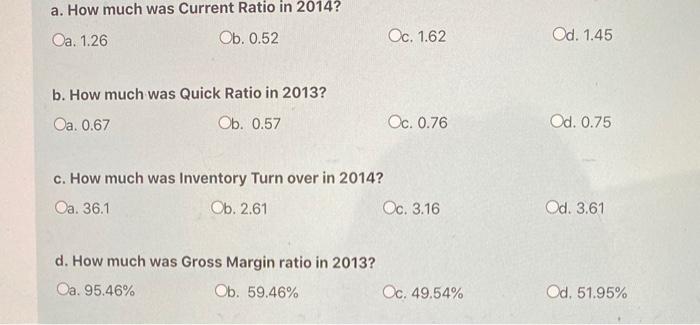
The following data represent selected information from the comparative income statement and balance sheet for Hot Rolled Corporation for the years ended December 31, 2014 and 2013: 2014 2013 $ 15,000 Cash $ 10,000 Net accounts receivable 30,000 Inventory 43,000 25,000 40,000 PP-Insurance 5,000 7,000 Total non-current assets 112,000 114,000 Total current liabilities 70,000 60,000 Total non-current liabilities 40,000 45,000 Number of shares 60,000 60,000 Net sales 370,000 333,000 150,000 160,000 Cost of goods sold Net income 70,000 57,000 75% of sales are usually on customers' accounts. a. How much was Current Ratio in 2014? Oa. 1.26 Ob. 0.52 Oc. 1.62 Od. 1.45 a. How much was Current Ratio in 2014? Oa. 1.26 Ob. 0.52 Oc. 1.62 Od. 1.45 b. How much was Quick Ratio in 2013? Oa. 0.67 Ob. 0.57 Oc. 0.76 Od. 0.75 c. How much was Inventory Turn over in 2014? Oa. 36.1 Ob. 2.61 Oc. 3.16 Od. 3.61 d. How much was Gross Margin ratio in 2013? Oa. 95.46% Ob. 59,46% Oc. 49.54% Od. 51.95%
Step by Step Solution
There are 3 Steps involved in it

Get step-by-step solutions from verified subject matter experts