

Question: Please help The following resting data were collected from three different sports teams (hockey, rugby and football). Ignoring the sport played, run a KolmogorovSmirnov test
Please help
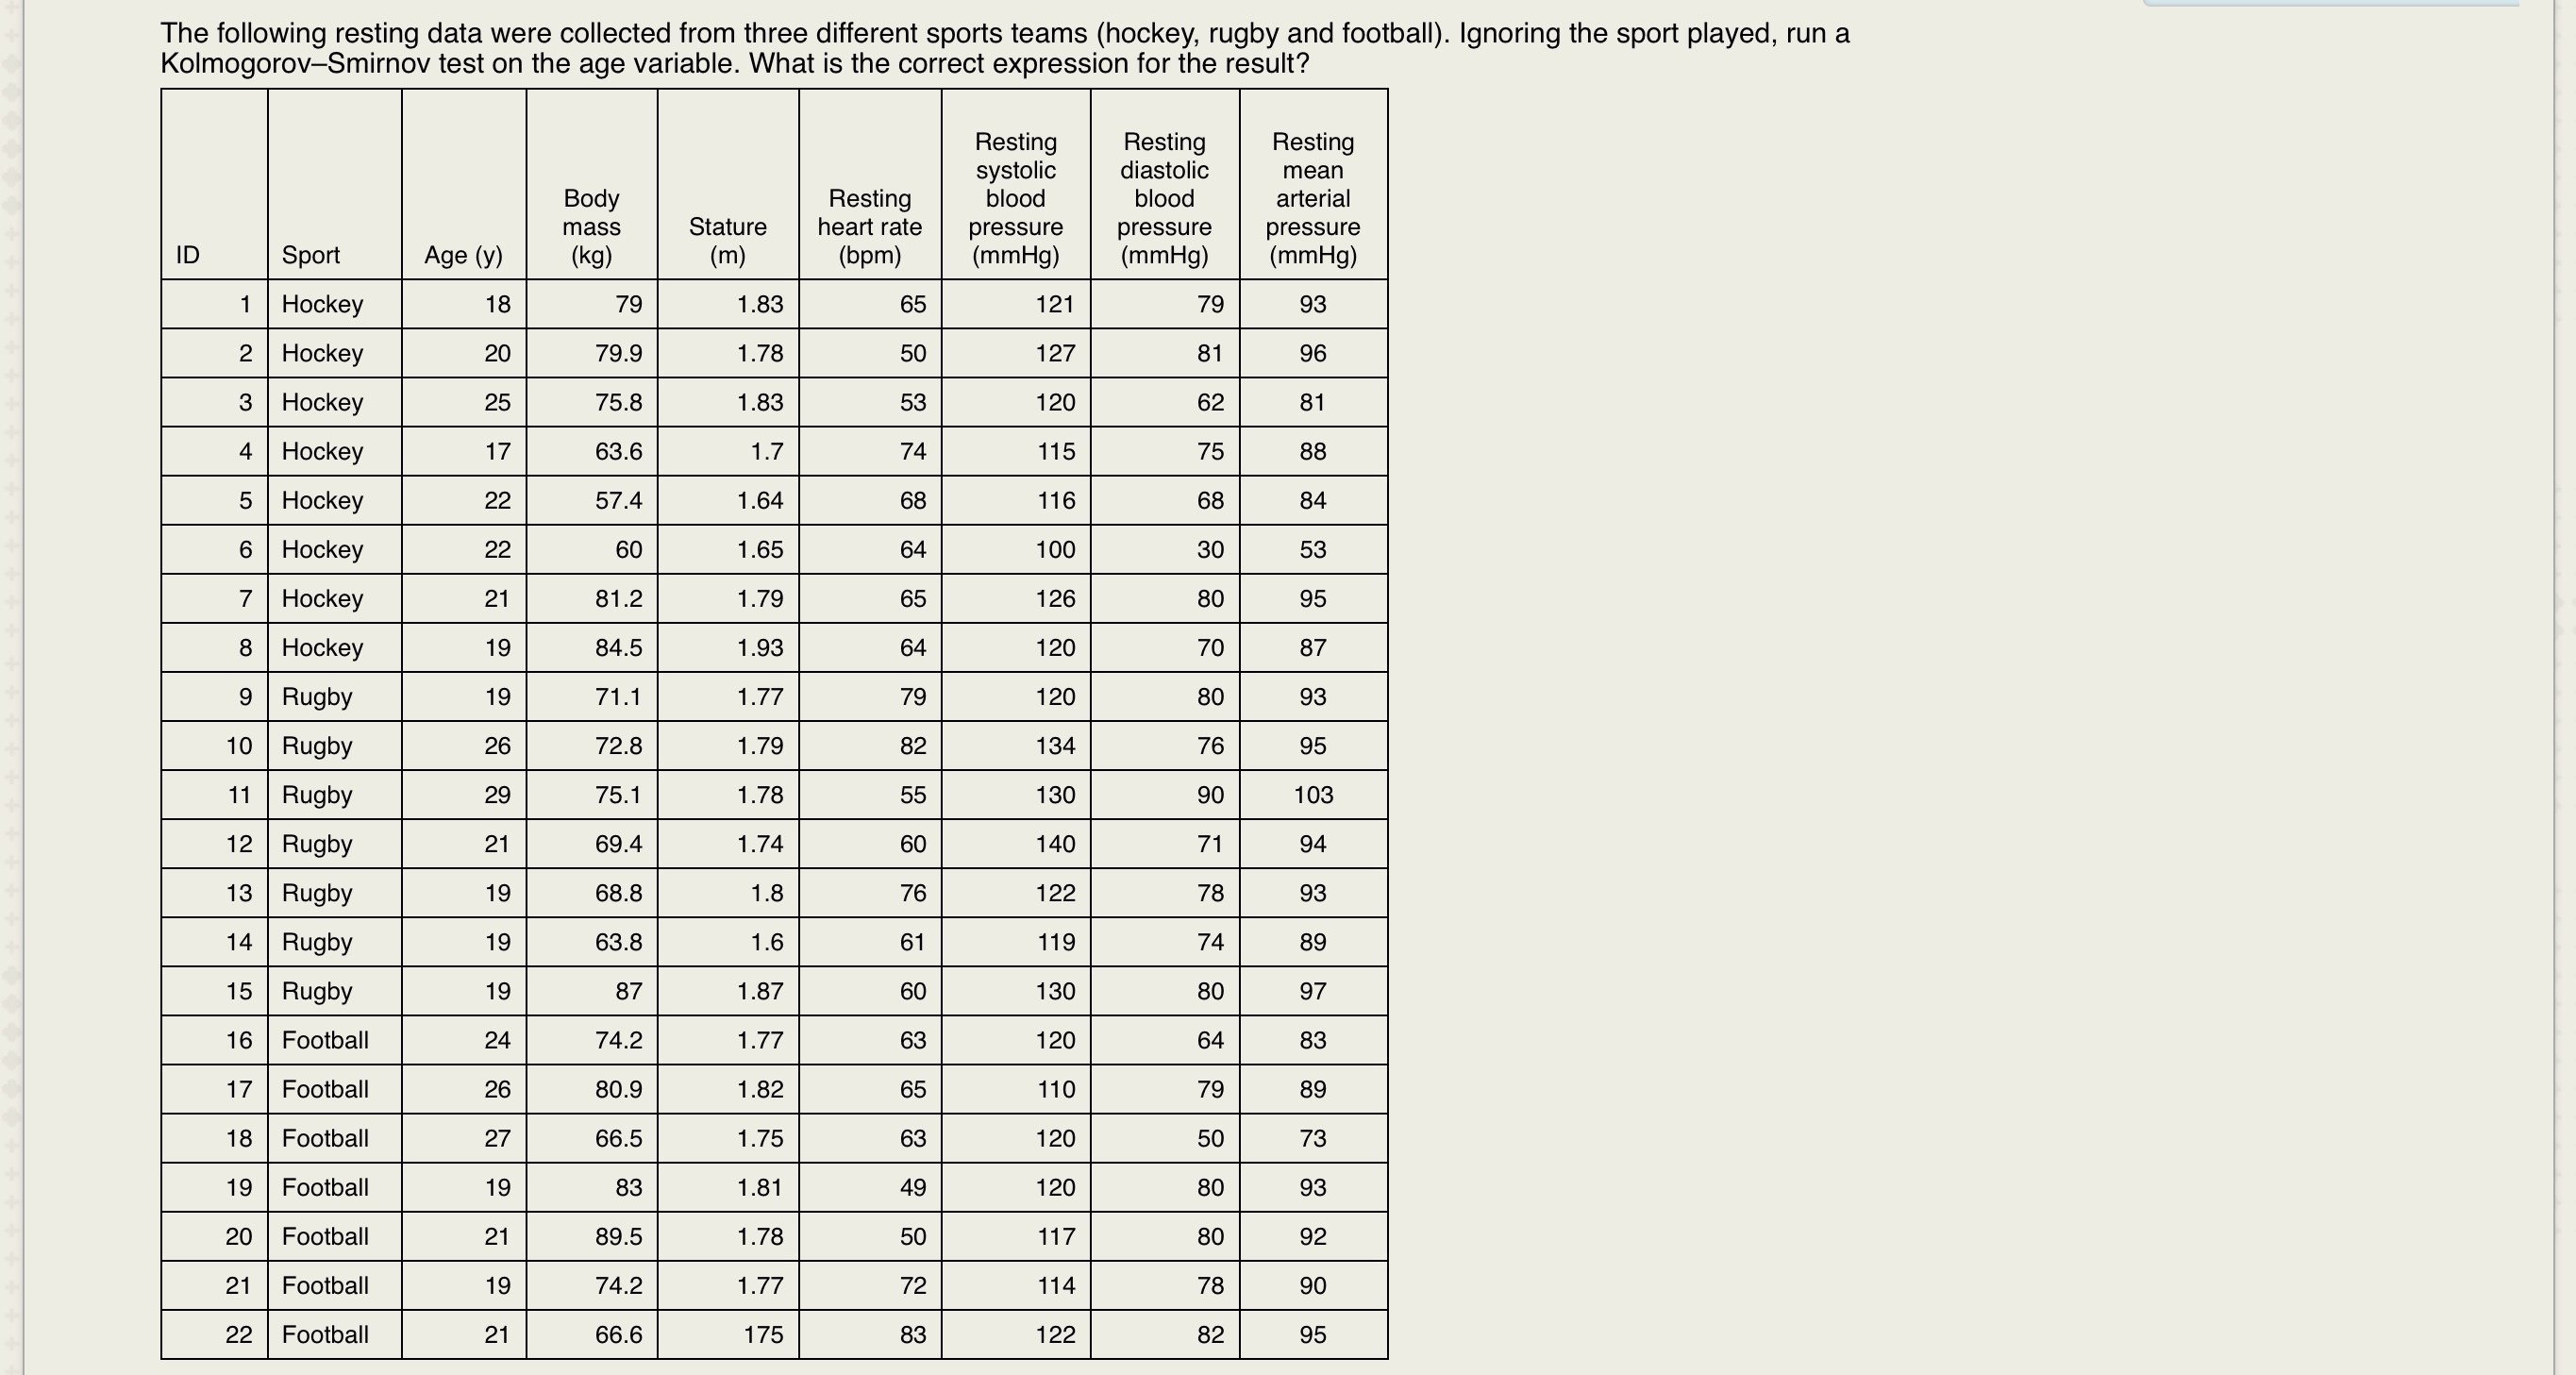


The following resting data were collected from three different sports teams (hockey, rugby and football). Ignoring the sport played, run a KolmogorovSmirnov test on the age variable. What is the correct expression for the result? Resting Resting Resting systolic diastolic mean Body Resting blood blood arterial mass Stature heart rate pressure pressure pressure ID SPOrt Age (V) (kg) ('11) (bpm) (mmHQ) (mmHg) (mmHg) 1 Hockey 18 79 1.83 65 121 79 93 2 Hockey 20 79.9 1.78 50 127 81 96 3 Hockey 25 75.3 1.83 53 120 62 81 4 Hockey 17 63.6 1.7 74 115 75 88 5 Hockey 22 57.4 1 .64 68 116 68 a4 6 Hockey 22 60 1.65 64 100 30 53 7 Hockey 21 81.2 1.79 65 126 80 95 8 Hockey 19 84.5 1.93 64 120 70 87 9 Rugby 19 71.1 1.77 79 120 80 93 10 Rugby 26 72.3 1.79 82 134 76 95 11 Rugby 29 75.1 1.78 55 130 90 103 12 Rugby 21 69.4 1.74 so 140 71 94 13 Rugby 19 68.8 1.8 76 122 78 93 14 Rugby 19 63.8 1.6 61 119 74 89 15 Rugby 19 87 1.87 60 130 80 97 16 Football 24 74.2 1.77 63 120 64 83 17 Football 26 80.9 1.82 65 110 79 89 18 Football 27 66.5 1.75 63 120 50 73 19 Football 19 83 1.81 49 120 80 93 20 Football 21 89.5 1.78 50 117 80 92 21 Football 19 74.2 1.77 72 114 78 90 22 Football 21 66.6 175 83 122 82 95 Which of the following descriptions refers to statistical bias? O a. The error between individual observations and a statistical model O b. The degree of similarity between individual observations and a statistical model O c. The error between individual observations O d. The degree of similarity between statistical modelsSources of bias can be reduced if which of the following assumptions are met? O a. Additvity / linearity O b. Data are normally distributed C. Homogeneity of variance O d. All of the above\fWhat does the central limit theorem state? O a. As sample size increases, the sample distribution better reflects the population distribution. O b. As sample size decreases, the sample distribution better reflects the population distribution. O c. As population size increases, the population distribution better reflects the sample distribution. O d. As population size decreases, the population distribution better reflects the sample distribution
Step by Step Solution
There are 3 Steps involved in it

Get step-by-step solutions from verified subject matter experts