

Question: Please help The following table categorises a random sample of students by faculty of enrolment and by the amount spent on textbooks in the previous
Please help
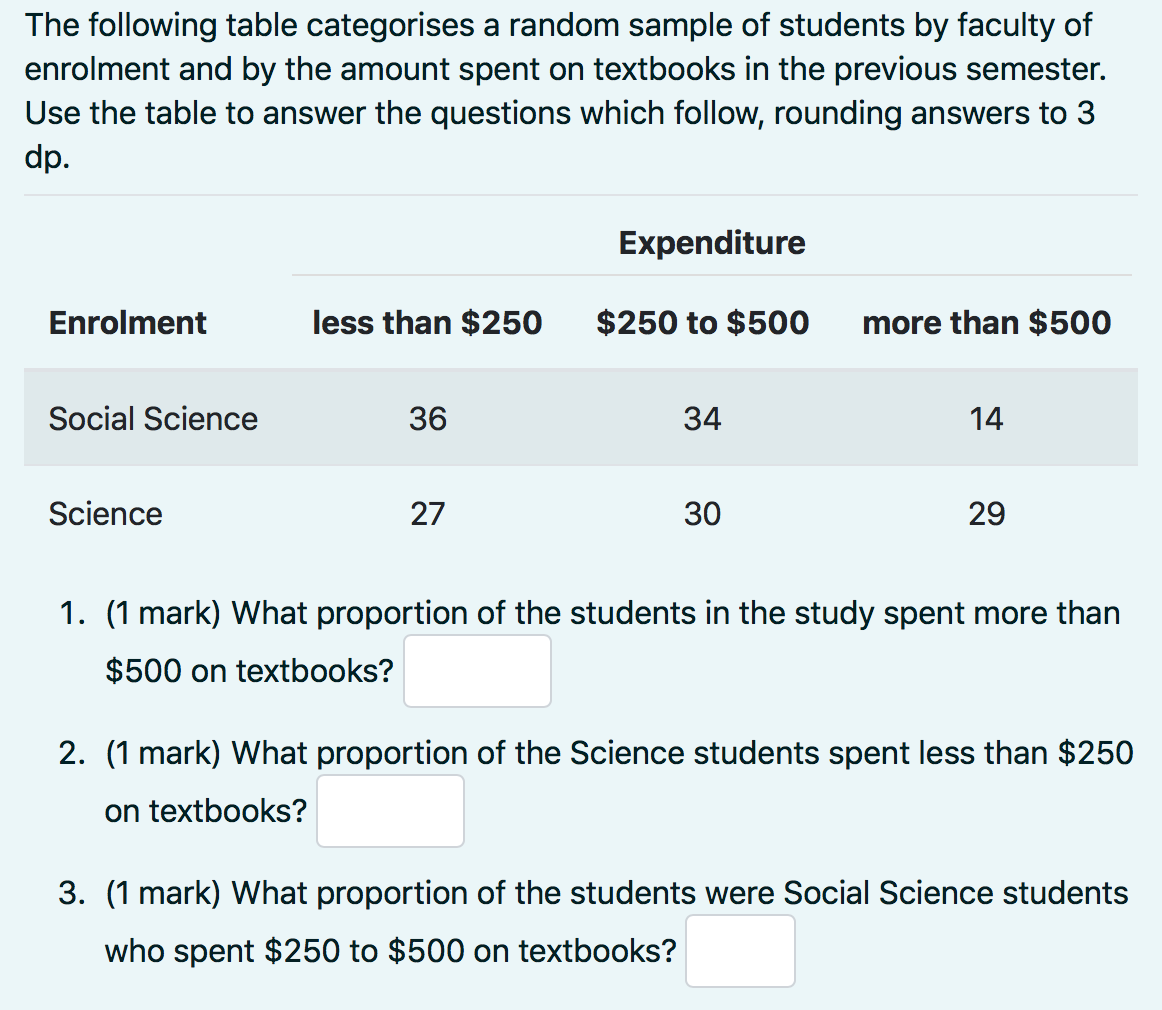
The following table categorises a random sample of students by faculty of enrolment and by the amount spent on textbooks in the previous semester. Use the table to answer the questions which follow, rounding answers to 3 dp. Expenditure Enrolment less than $250 $250 to $500 more than $500 Social Science 36 34 14 Science 27 30 29 1. (1 mark) What proportion of the students in the study spent more than $500 on textbooks? 2. (1 mark) What proportion of the Science students spent less than $250 on textbooks? 3. (1 mark) What proportion of the students were Social Science students who spent $250 to $500 on textbooks
Step by Step Solution
There are 3 Steps involved in it

Get step-by-step solutions from verified subject matter experts