

Question: PLEASE HELP The graphs below are obtained from continuous normal distribution with the variable X with the mean of 45 and the standard deviation of
PLEASE HELP

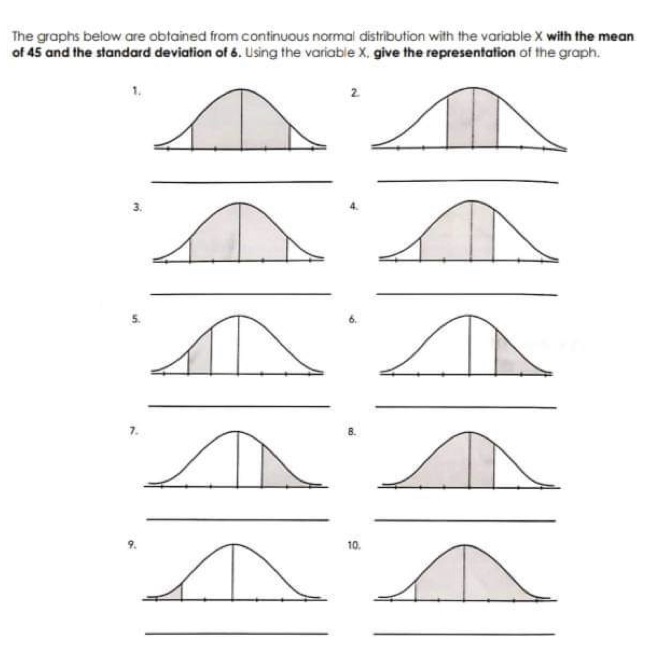
The graphs below are obtained from continuous normal distribution with the variable X with the mean of 45 and the standard deviation of 6. Using the variable X, give the representation of the graph. 5. DIDIDIDI 7. 9. 10
Step by Step Solution
There are 3 Steps involved in it
1 Expert Approved Answer
Step: 1 Unlock

Question Has Been Solved by an Expert!
Get step-by-step solutions from verified subject matter experts
Step: 2 Unlock
Step: 3 Unlock