

Question: please help ! The Information below comes from the financial statements of Rosson Company. Rosson Company Income Statement Years ended 2017 and 2018 2018 2017
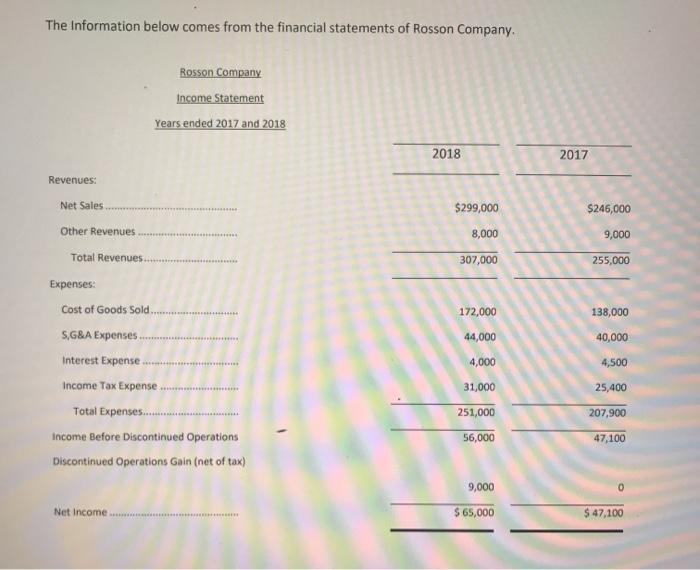
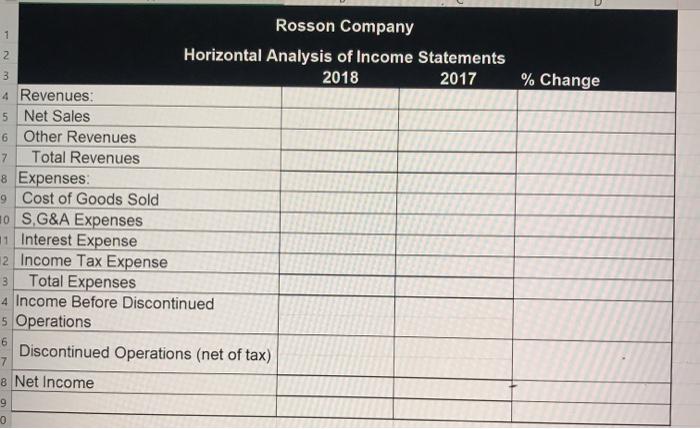
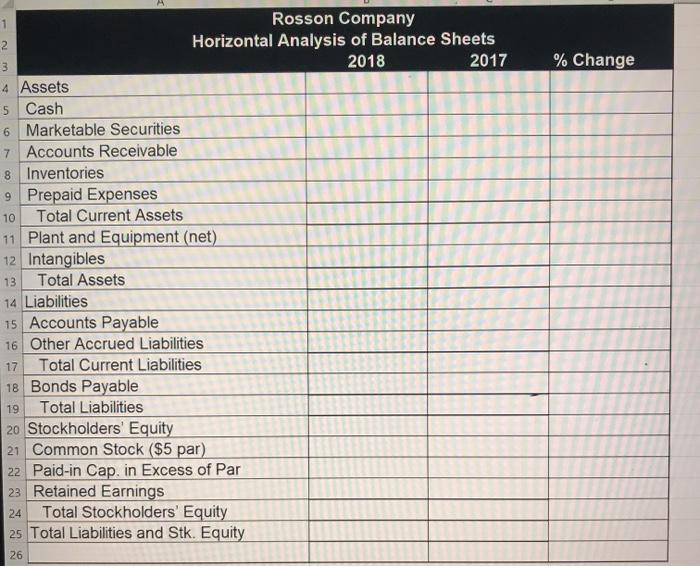
The Information below comes from the financial statements of Rosson Company. Rosson Company Income Statement Years ended 2017 and 2018 2018 2017 Revenues: Net Sales $299,000 $246,000 Other Revenues 8,000 9,000 Total Revenues 307,000 255,000 172,000 138,000 ***** 44,000 40,000 4,000 4,500 Expenses: Cost of Goods Sold S.G&A Expenses Interest Expense Income Tax Expense Total Expenses... Income Before Discontinued Operations Discontinued Operations Gain (net of tax) 31,000 25,400 251,000 207,900 56,000 47,100 9,000 0 Net Income $ 65,000 $ 47,100 1 wuN % Change Rosson Company Horizontal Analysis of Income Statements 3 2018 2017 4 Revenues: 5 Net Sales 6 Other Revenues 7 Total Revenues 8 Expenses 9 Cost of Goods Sold 0 S.G&A Expenses 1 Interest Expense 12 Income Tax Expense 3 Total Expenses 4 Income Before Discontinued 5 Operations 6 Discontinued Operations (net of tax) 8 Net Income 9 0 % Change 5 Rosson Company 2 Horizontal Analysis of Balance Sheets 3 2018 2017 4 Assets Cash 6 Marketable Securities 7 Accounts Receivable 8 Inventories 9 Prepaid Expenses 10 Total Current Assets 11 Plant and Equipment (net) 12 Intangibles 13 Total Assets 14 Liabilities 15 Accounts Payable 16 Other Accrued Liabilities Total Current Liabilities 18 Bonds Payable 19 Total Liabilities 20 Stockholders' Equity 21 Common Stock ($5 par) 22 Paid-in Cap. in Excess of Par 23 Retained Earnings Total Stockholders' Equity 25 Total Liabilities and Stk. Equity 17 24 26
Step by Step Solution
There are 3 Steps involved in it

Get step-by-step solutions from verified subject matter experts