

Question: PLEASE HELP!! The probability distribution of the random variable X represents the number of hits a baseball player obtained in a game for the 2012
PLEASE HELP!!
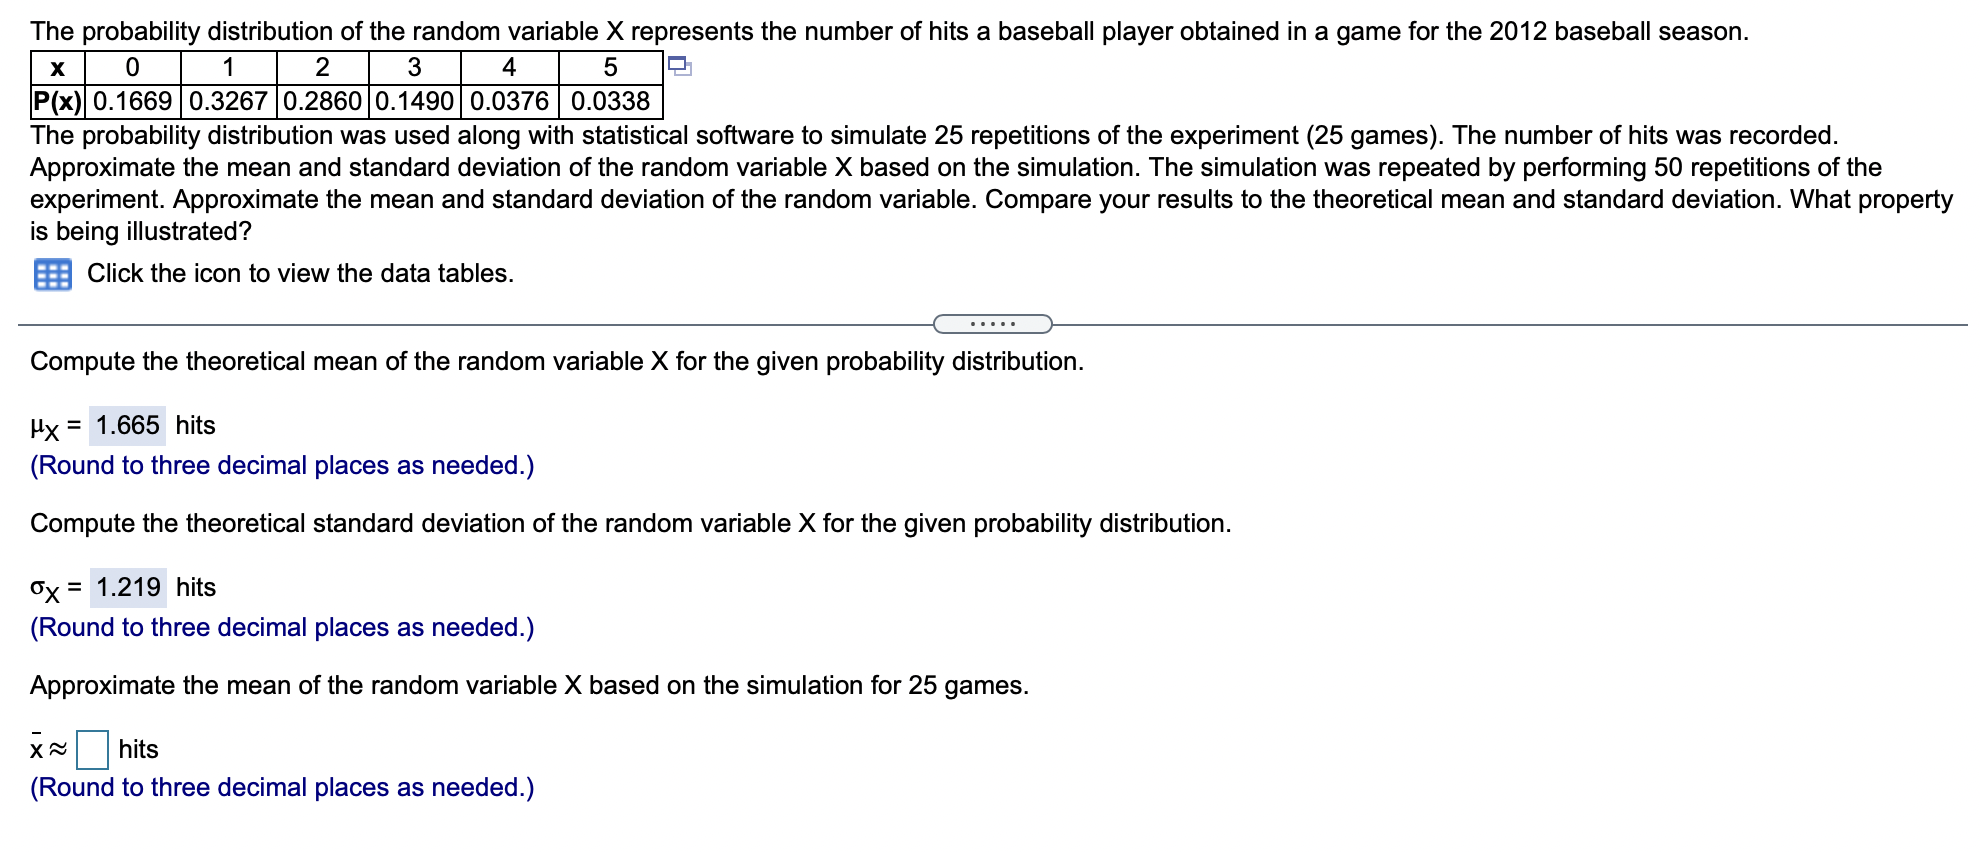
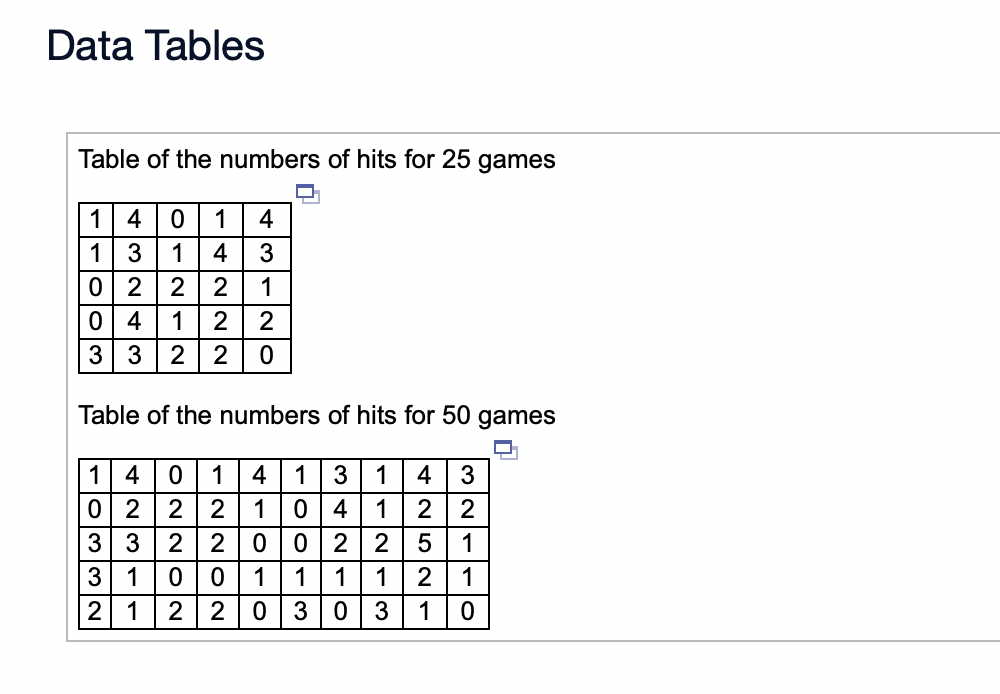
The probability distribution of the random variable X represents the number of hits a baseball player obtained in a game for the 2012 baseball season. tannin-nus P(x) 0.1669 0.3267 0.2860 0.1490 0.0376 0.0338 The probability distribution was used along with statistical software to simulate 25 repetitions of the experiment (25 games). The number of hits was recorded. Approximate the mean and standard deviation of the random variable X based on the simulation. The simulation was repeated by performing 50 repetitions of the experiment. Approximate the mean and standard deviation of the random variable. Compare your results to the theoretical mean and standard deviation. What property is being illustrated? g Click the icon to view the data tables. Compute the theoretical mean of the random variable X for the given probability distribution. px = 1.665 hits (Round to three decimal places as needed.) Compute the theoretical standard deviation of the random variable X for the given probability distribution. ox: 1.219 hits (Round to three decimal places as needed.) Approximate the mean of the random variable X based on the simulation for 25 games. is D hits (Round to three decimal places as needed.) Data Tables Table of the numbers of hits for 25 games 1 4 0 1 4 3 1 4 3 0 2 2 2 1 0 4 1 2 2 3 3 2 2 0 Table of the numbers of hits for 50 games 1 4 0 1 4 1 3 1 4 3 0 2 12 2 1 0 4 1 2 2 3 3 1 2 2 10 0 2 2 5 1 3 1 0 0 1 1 1 1 2 1 2 1 2 2 0 3 0 3 1 0
Step by Step Solution
There are 3 Steps involved in it

Get step-by-step solutions from verified subject matter experts