

Question: please help The scatterplot below shows the temperatures in Montgomery, AL over a period ten days. DAY TEMP 1 56 2 52 3 55 4
please help
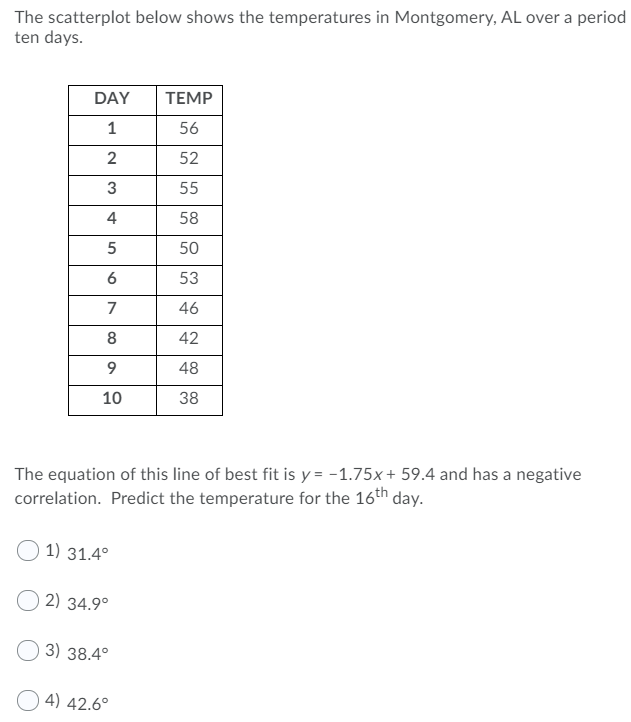
The scatterplot below shows the temperatures in Montgomery, AL over a period ten days. DAY TEMP 1 56 2 52 3 55 4 58 5 50 6 53 7 46 8 42 9 48 10 38 The equation of this line of best fit is y = -1.75x + 59.4 and has a negative correlation. Predict the temperature for the 16th day. ( 1) 31.40 ( 2) 34.90 ( 3) 38.40 ( 4) 42.60
Step by Step Solution
There are 3 Steps involved in it
1 Expert Approved Answer
Step: 1 Unlock

Question Has Been Solved by an Expert!
Get step-by-step solutions from verified subject matter experts
Step: 2 Unlock
Step: 3 Unlock