

Question: please help The table below contains data on Fincorp Inc. The balance sheet items correspond to values at year-end 2018 and 2019, while the income
please help
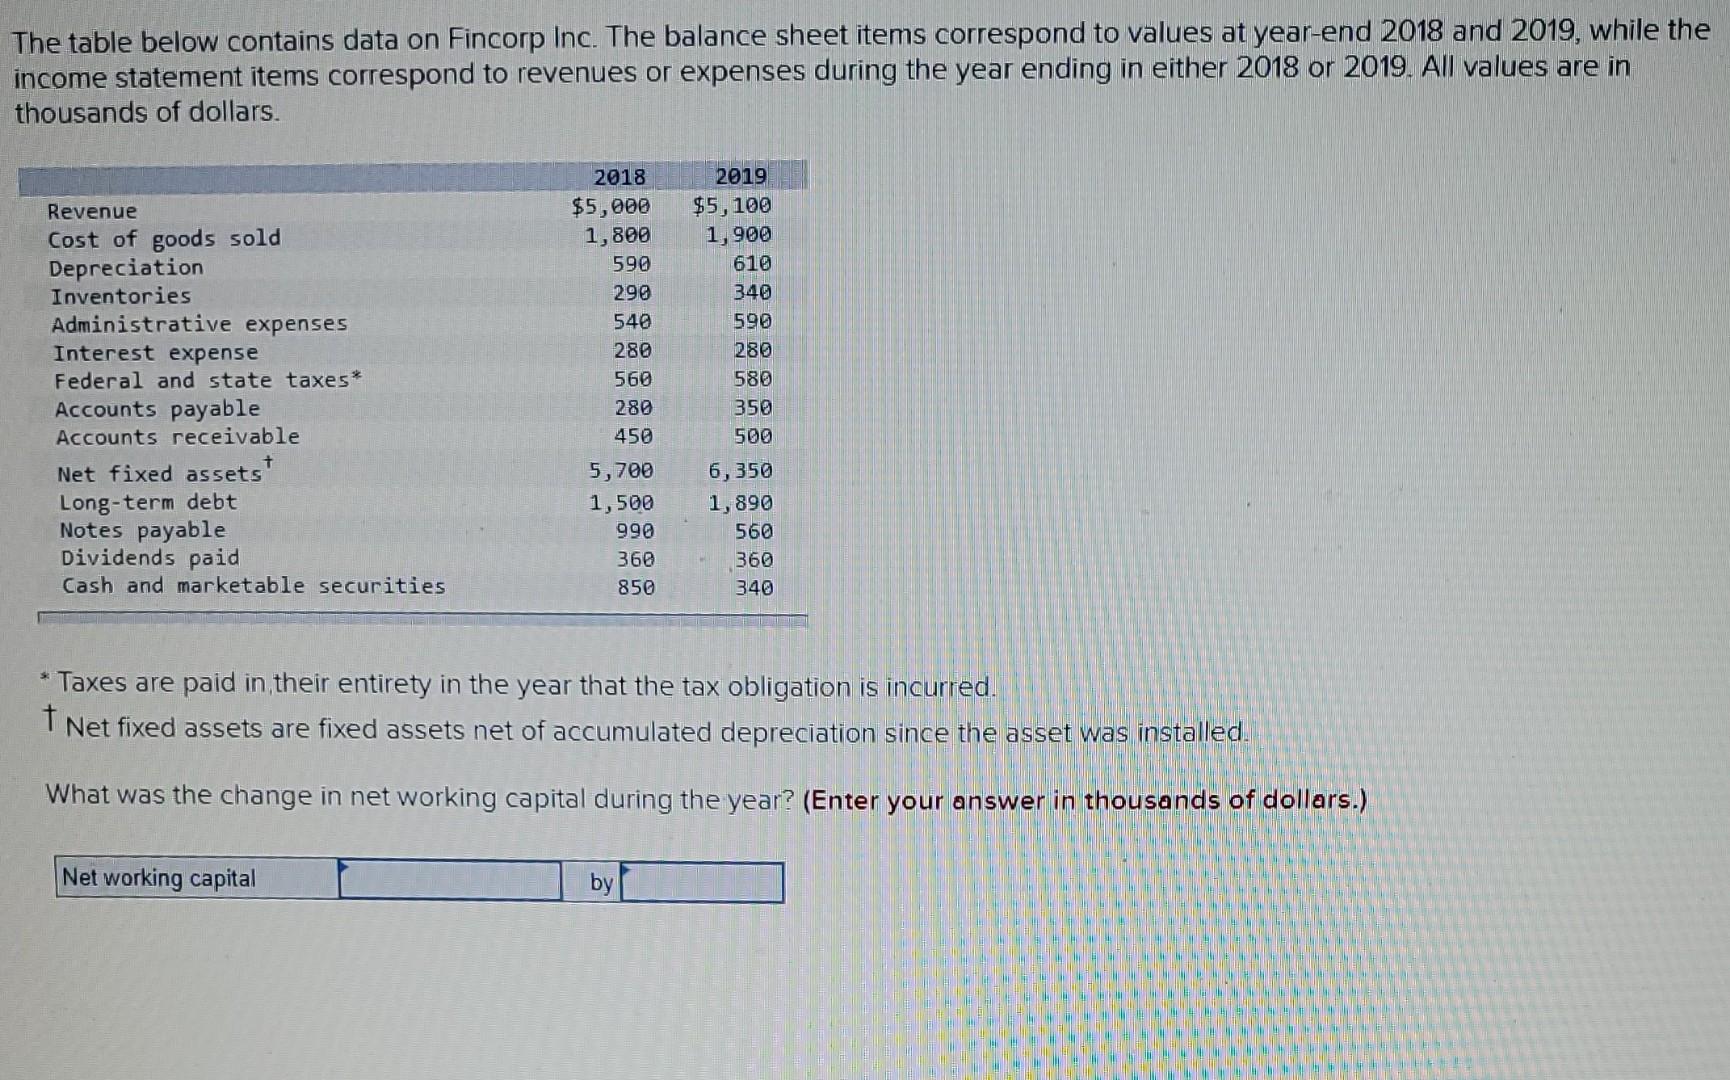
The table below contains data on Fincorp Inc. The balance sheet items correspond to values at year-end 2018 and 2019, while the income statement items correspond to revenues or expenses during the year ending in either 2018 or 2019. All values are in thousands of dollars. Revenue Cost of goods sold Depreciation Inventories Administrative expenses Interest expense Federal and state taxes Accounts payable Accounts receivable Net fixed assets Long-term debt Notes payable Dividends paid Cash and marketable securities 2018 $5,000 1,800 590 290 540 280 560 280 450 2019 $5,100 1,900 610 340 590 280 580 350 500 5,700 1,500 990 360 850 6,350 1,890 560 360 340 * Taxes are paid in their entirety in the year that the tax obligation is incurred. Net fixed assets are fixed assets net of accumulated depreciation since the asset was installed. What was the change in net working capital during the year? (Enter your answer in thousands of dollars.) Net working capital by
Step by Step Solution
There are 3 Steps involved in it

Get step-by-step solutions from verified subject matter experts