

Question: please help The table below shows quarterly air conditioner sales (starting from the 2nd quarter in 2016) in thousands of Rands for an electrical goods
please help
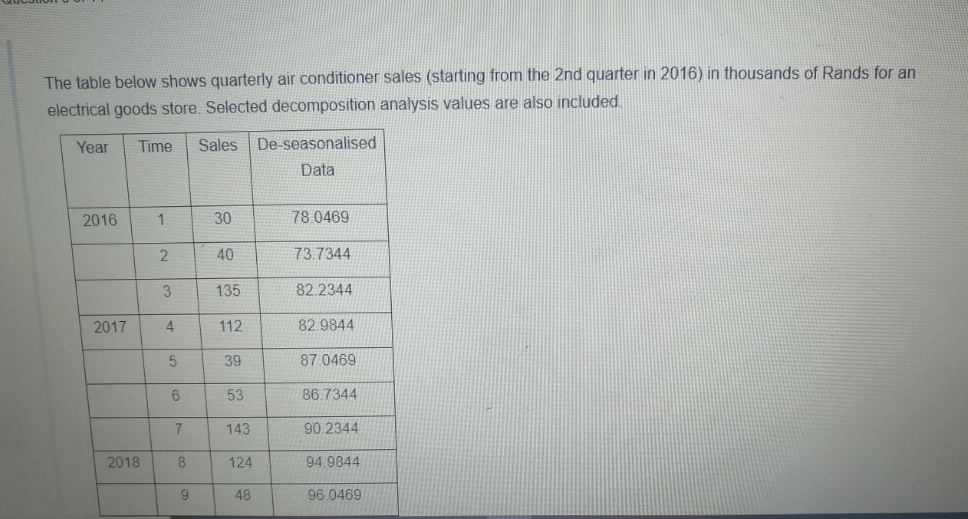
The table below shows quarterly air conditioner sales (starting from the 2nd quarter in 2016) in thousands of Rands for an electrical goods store. Selected decomposition analysis values are also included Year Time Sales De-seasonalised Data 2016 30 78 0469 2 40 73.7344 3 135 82.2344 2017 4 112 82.9844 5 39 87 0469 6 53 86.7344 7 143 90.2344 2018 8 124 94 9844 9 48 96.0469
Step by Step Solution
There are 3 Steps involved in it
1 Expert Approved Answer
Step: 1 Unlock

Question Has Been Solved by an Expert!
Get step-by-step solutions from verified subject matter experts
Step: 2 Unlock
Step: 3 Unlock