

Question: please help. these are the numbers needing to be put in the free graph. thank you! 2.5122 2.5527 2.5196 2.5222 2.5203 2.4982 2.5246 2.4605 2.5076
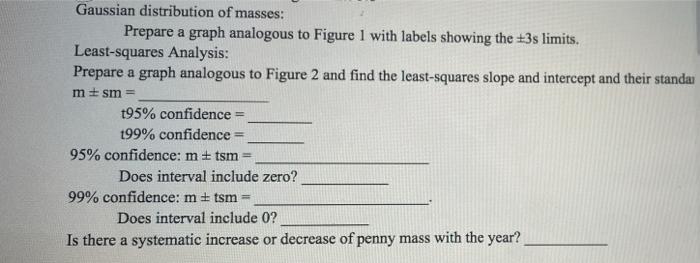
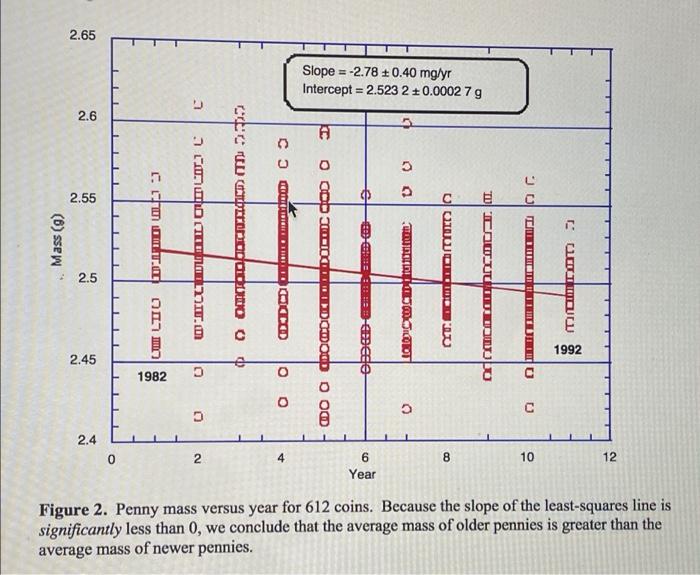
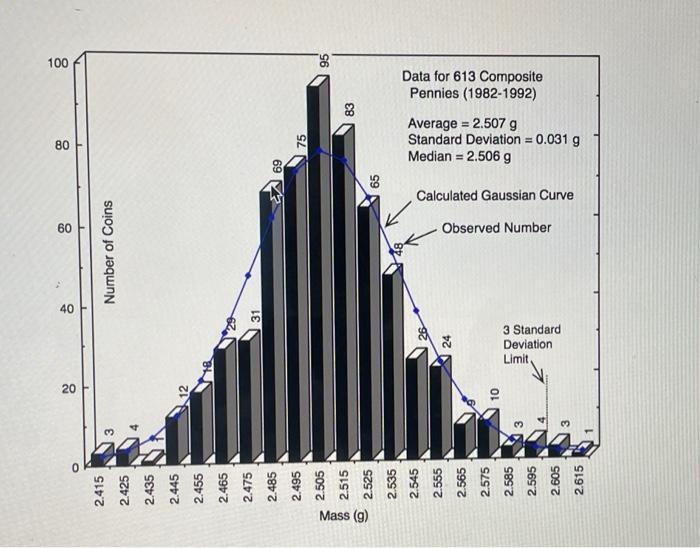
Gaussian distribution of masses: Prepare a graph analogous to Figure 1 with labels showing the +3s limits. Least-squares Analysis: Prepare a graph analogous to Figure 2 and find the least-squares slope and intercept and their standar msm = t95% confidence = t99% confidence = 95% confidence: mtsm= Does interval include zero? 99% confidence: mtsm= Does interval include 0? Is there a systematic increase or decrease of penny mass with the year? 2.65 Slope = -2.78 +0.40 mg/yr Intercept = = 2.523 2 +0.0002 7g 11 2.6 fe C9 C 2.55 C . -- > Mas (g) .C 2.5 TOGETHEROCOCCOD O Qob INTELLIDODODD OOO uD0 Rele UUUUUU OC 1992 2.45 th 1982 C O 0 C C C 2.4 0 0 2 4 9 8 10 12 Year Figure 2. Penny mass versus year for 612 coins. Because the slope of the least-squares line is significantly less than 0, we conclude that the average mass of older pennies is greater than the average mass of newer pennies. 100 Data for 613 Composite Pennies (1982-1992) 80 75 Average = 2.507 g Standard Deviation = 0.0319 Median = 2.506 g A 69 65 Calculated Gaussian Curve 60 Observed Number Number of Coins 40 3 Standard Deviation Limit 20 10 N3 2.415 2.425 2.475 2.485 2.495 2.515 2.525 2.535 2.545 3 2.505 2.555 2.595 2.605 2.615 Mass (9)
Step by Step Solution
There are 3 Steps involved in it

Get step-by-step solutions from verified subject matter experts