

Question: please help these - How are dotplots and stem-and-leaf displays similar? O Dotplots and stem-and-leaf displays both group data points into categories. Neither dotplots nor
please help these
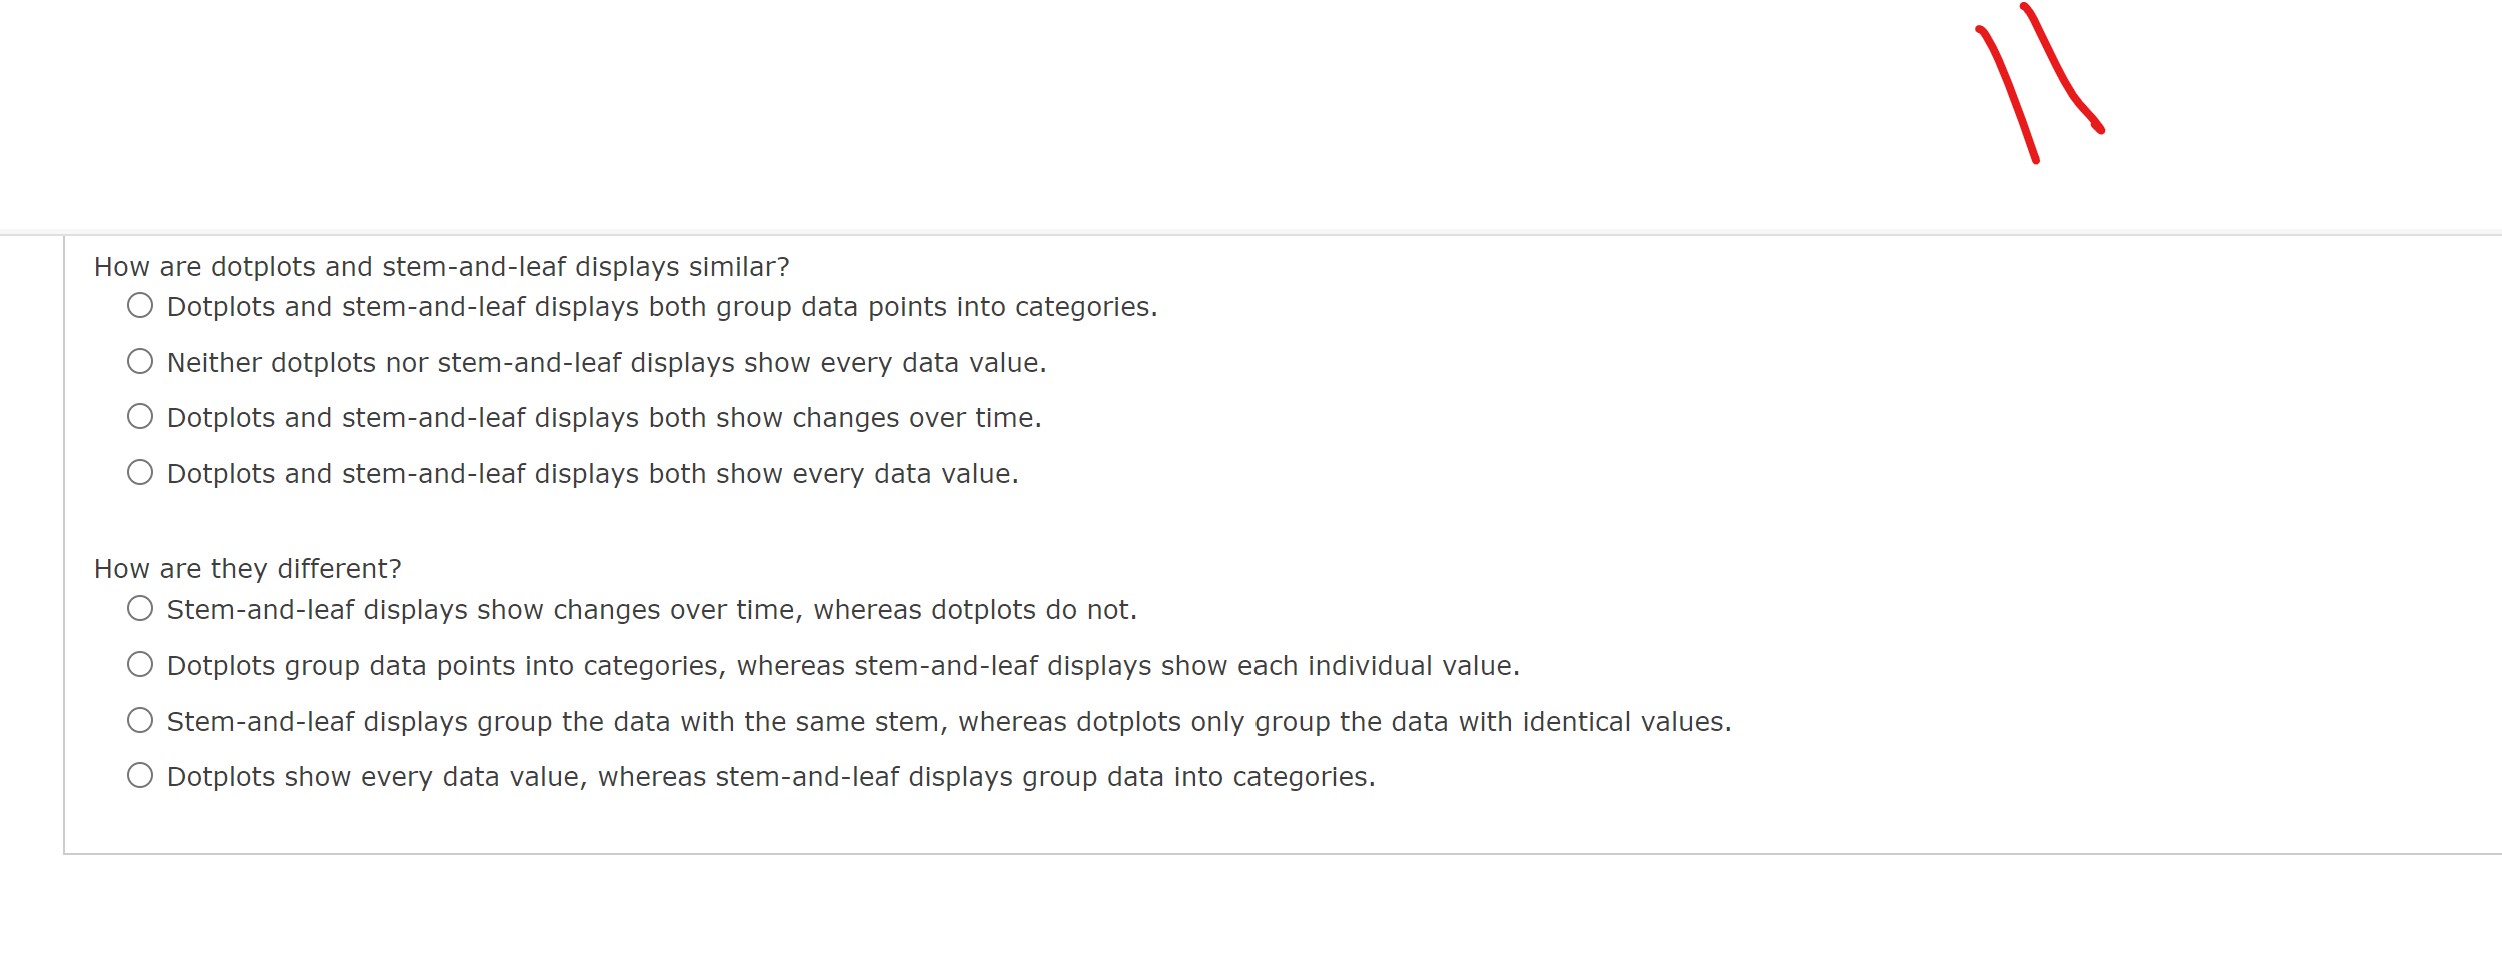
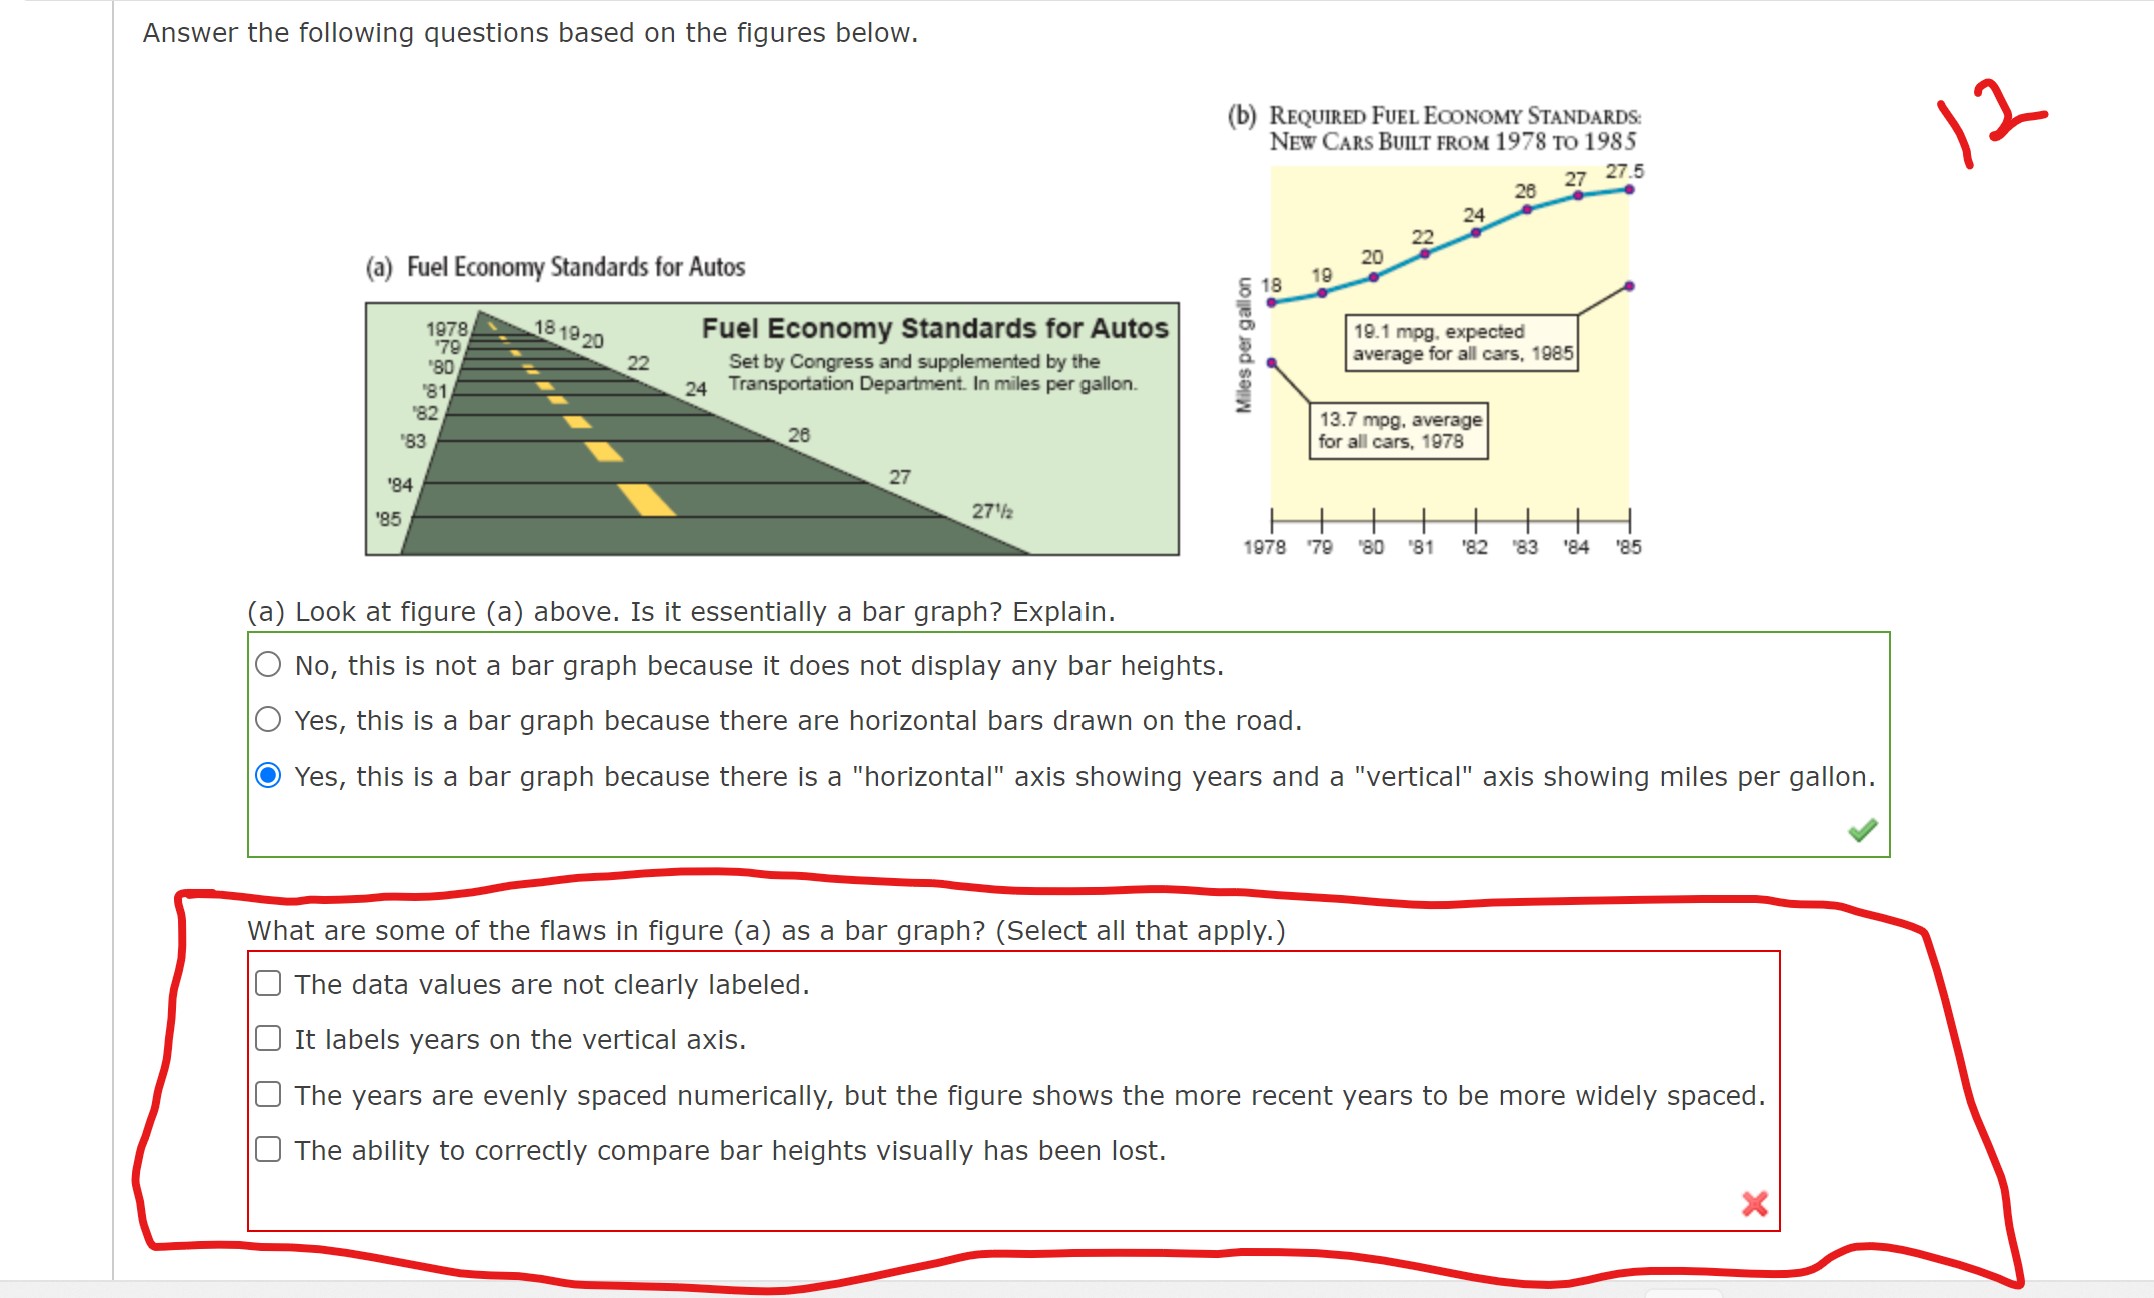


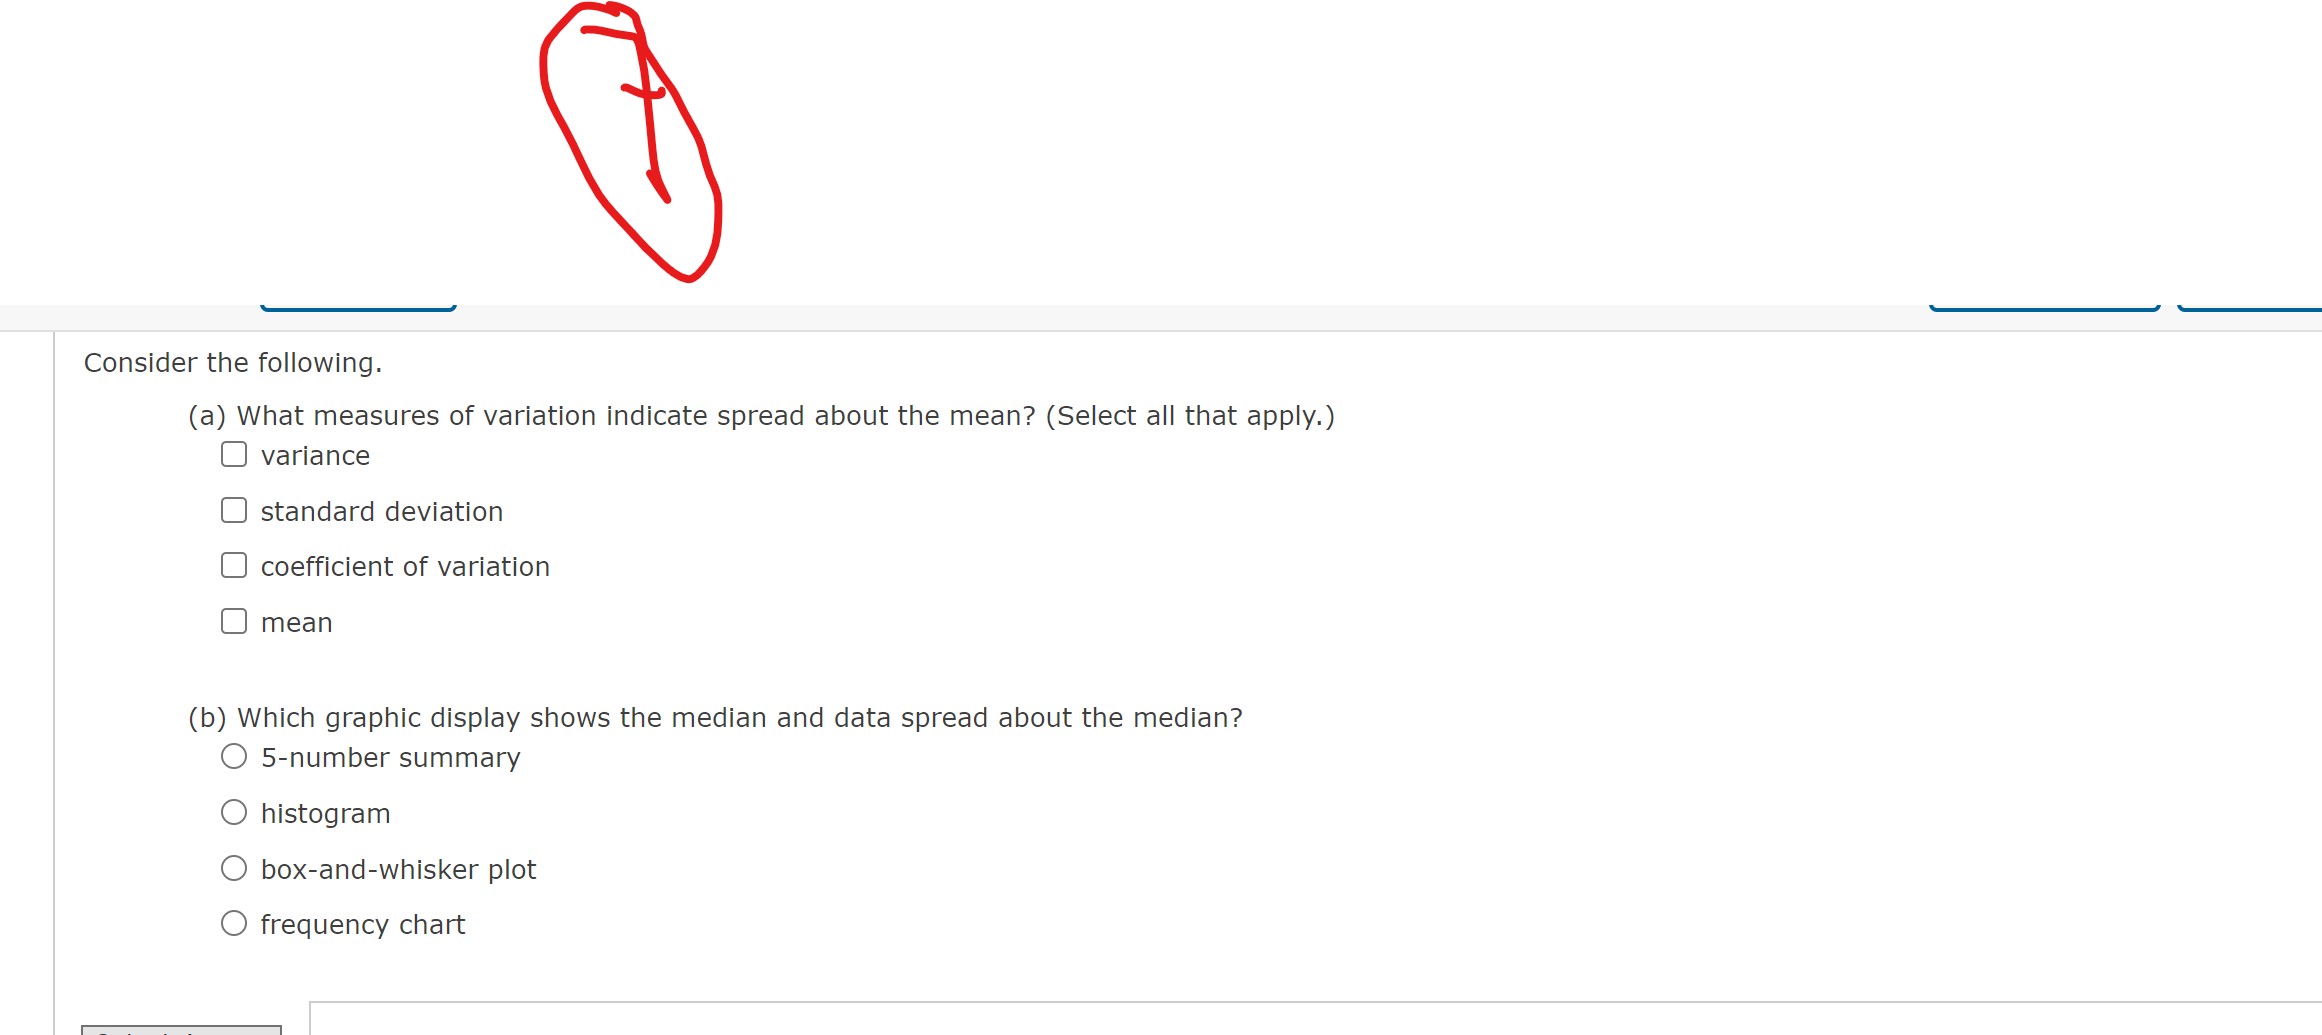
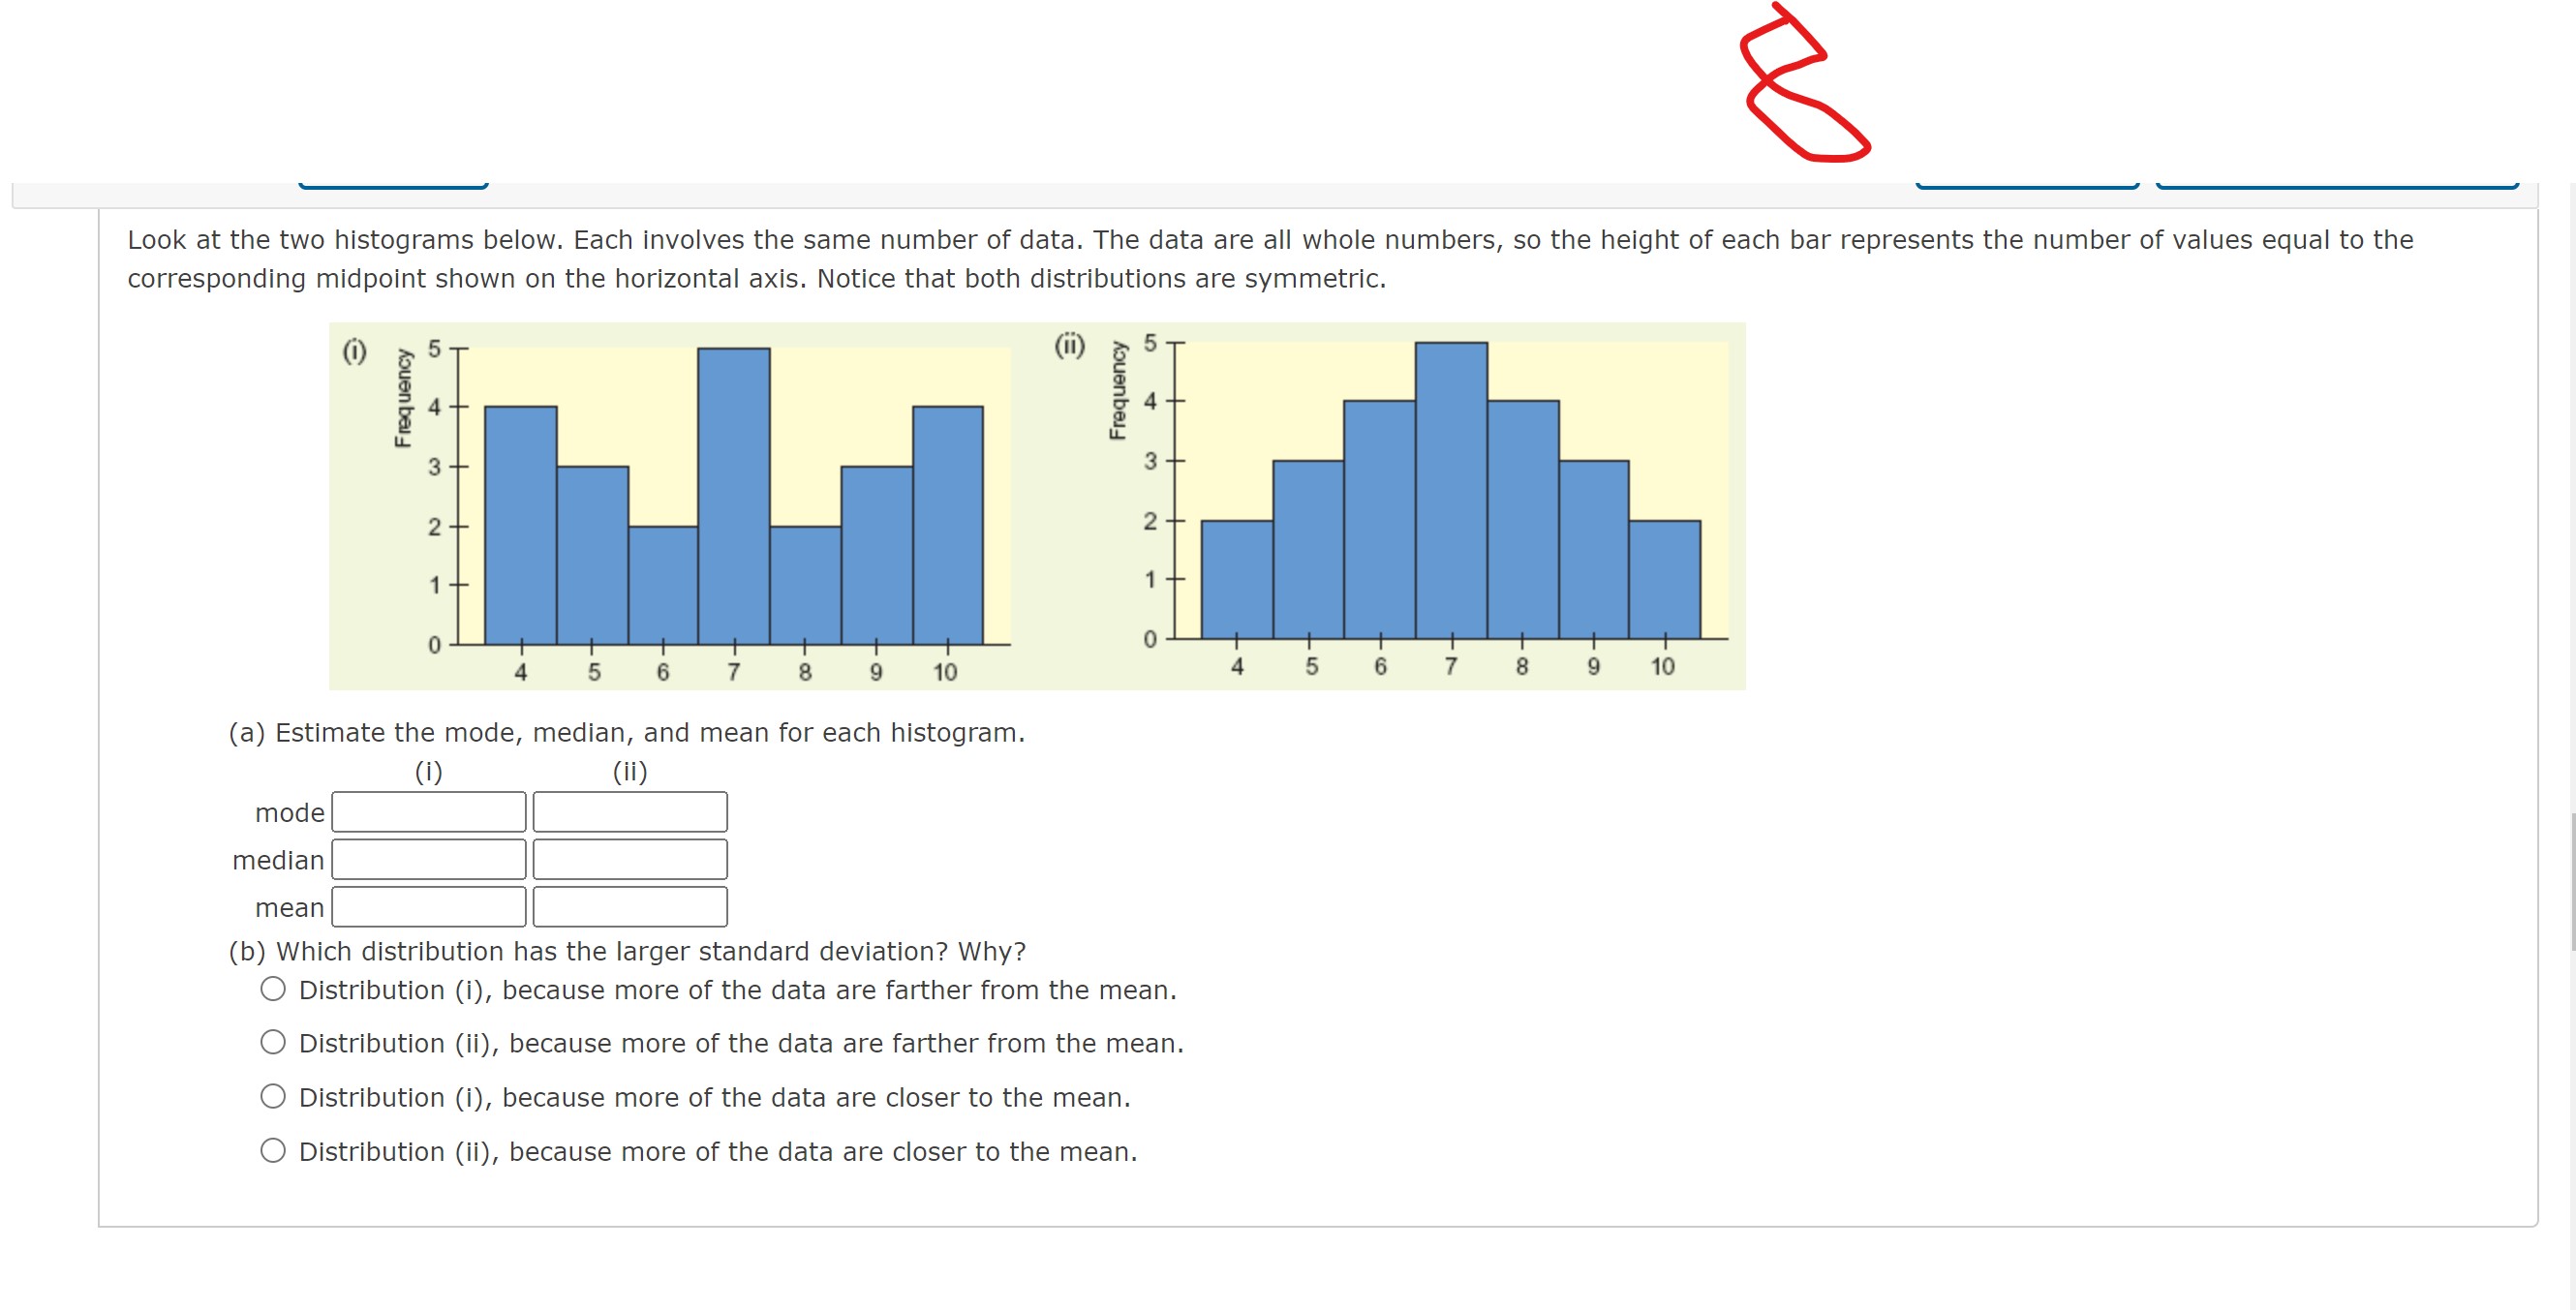
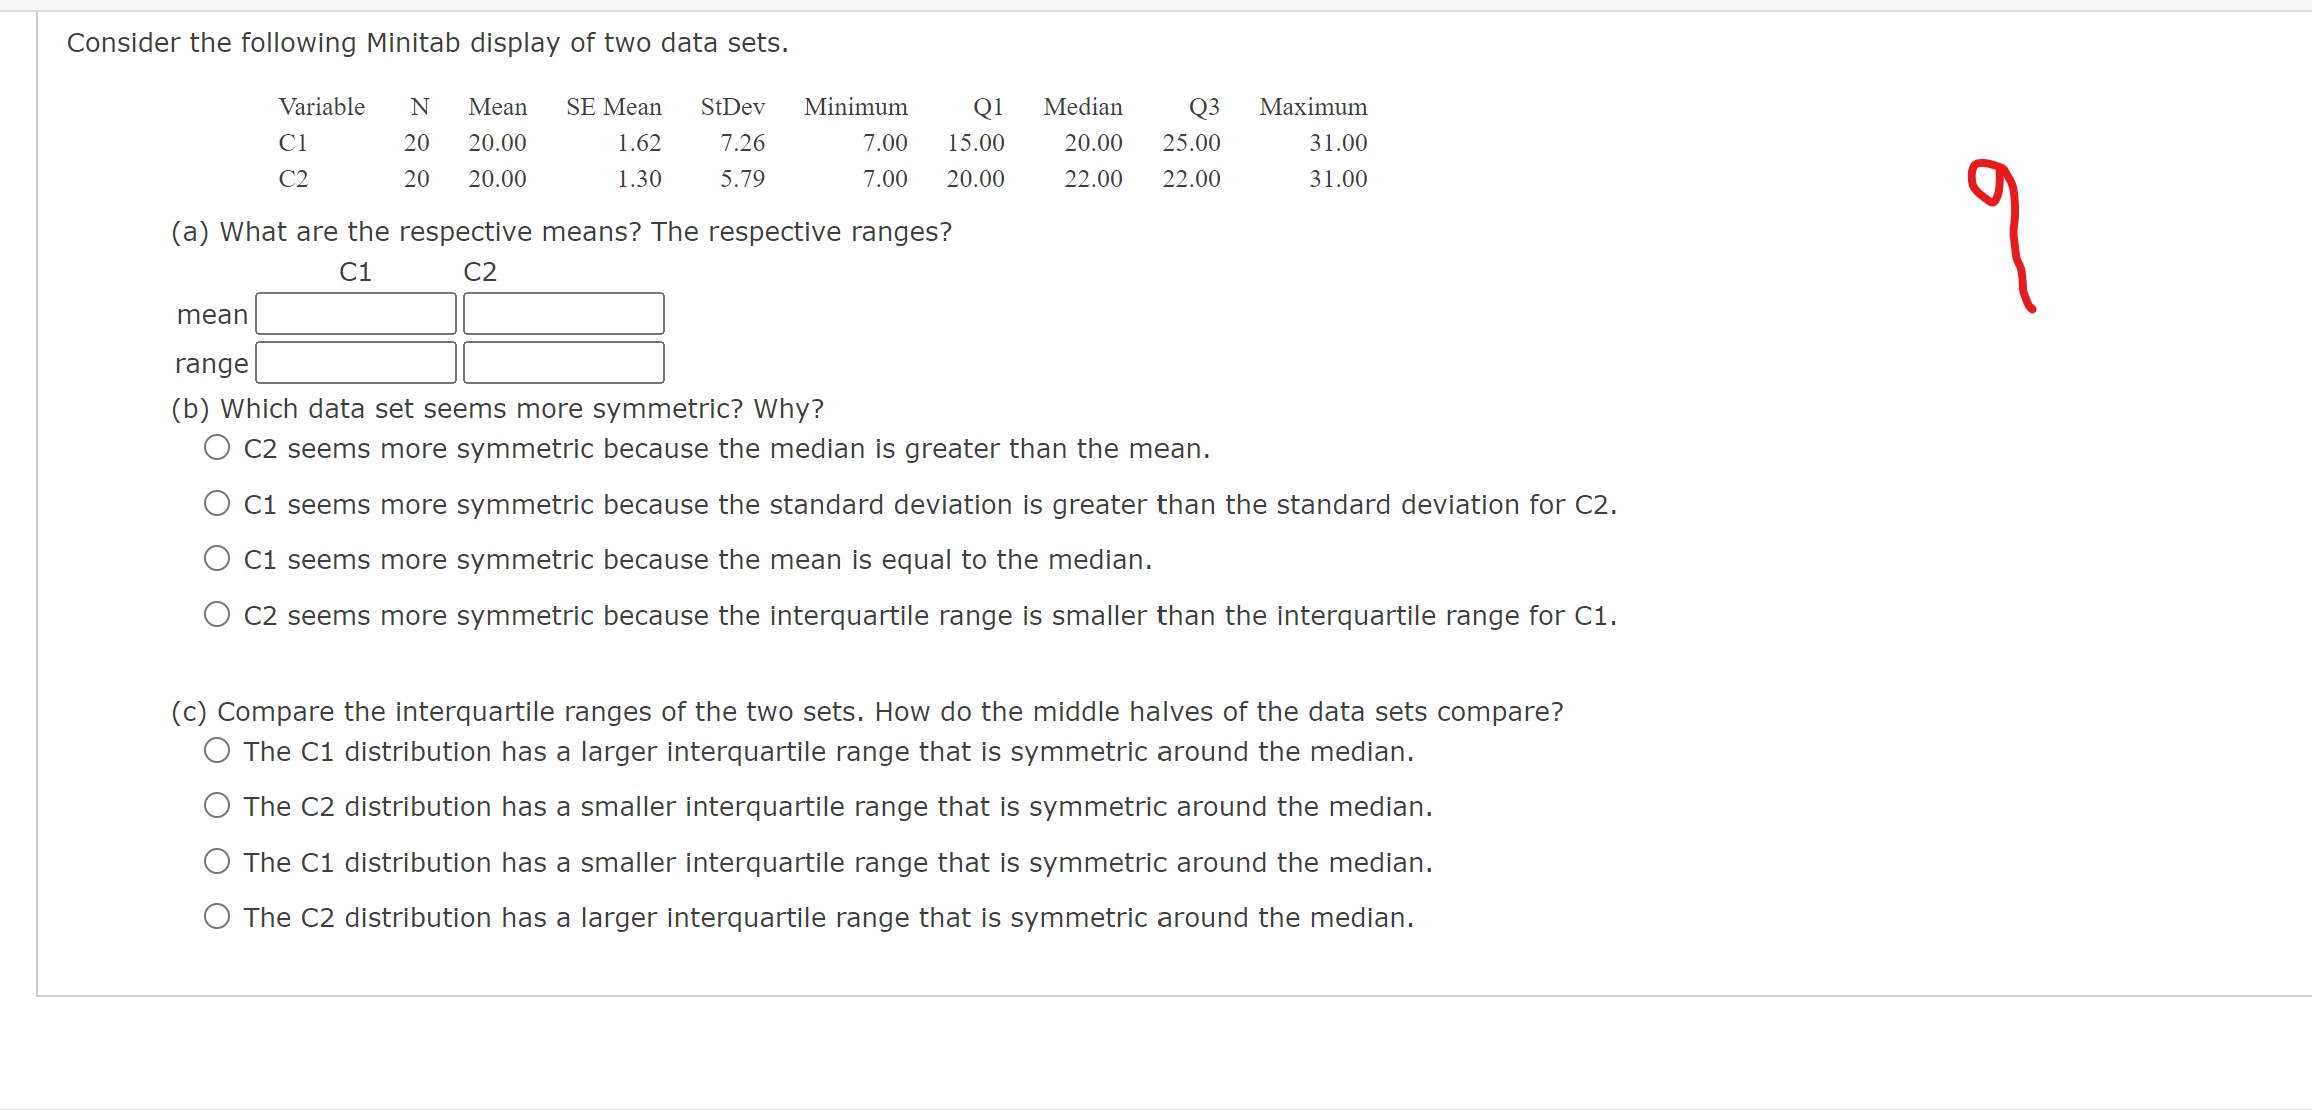
- How are dotplots and stem-and-leaf displays similar? O Dotplots and stem-and-leaf displays both group data points into categories. Neither dotplots nor stem-and-leaf displays show every data value. O Dotplots and stem-and-leaf displays both show changes over time. O Dotplots and stem-and-leaf displays both show every data value. How are they different? O Stem-and-leaf displays show changes over time, whereas dotplots do not. O Dotplots group data points into categories, whereas stem-and-leaf displays show each individual value. O Stem-and-leaf displays group the data with the same stem, whereas dotplots only group the data with identical values. O Dotplots show every data value, whereas stem-and-leaf displays group data into categories.Answer the following questions based on the figures below. (b) REQUIRED FUEL ECONOMY STANDARDS: NEW CARS BUILT FROM 1978 TO 1985 12 28 27 27.5 24 22 (a) Fuel Economy Standards for Autos 20 $ 18 19 1978 18 19 20 Fuel Economy Standards for Autos 19.1 mpg. expected 79 Miles per gallon '80 22 Set by Congress and supplemented by the average for all cars, 1985 "81 24 Transportation Department. In miles per gallon. '82 13.7 mpg, average '83 26 for all cars, 1978 184 27 '85 271/ 1978 79 80 '83 184 185 (a) Look at figure (a) above. Is it essentially a bar graph? Explain. O No, this is not a bar graph because it does not display any bar heights. Yes, this is a bar graph because there are horizontal bars drawn on the road. Yes, this is a bar graph because there is a "horizontal" axis showing years and a "vertical" axis showing miles per gallon. What are some of the flaws in figure (a) as a bar graph? (Select all that apply.) The data values are not clearly labeled. It labels years on the vertical axis. The years are evenly spaced numerically, but the figure shows the more recent years to be more widely spaced. O The ability to correctly compare bar heights visually has been lost. XConsider the following. (a) What measures of variation indicate spread about the mean? (Select all that apply.) variance standard deviation coefficient of variation mean (b) Which graphic display shows the median and data spread about the median? O Snumber summary 0 histogram O boxandwhisker plot 0 frequency chart Look at the two histograms below. Each involves the same number of data. The data are all whole numbers, so the height of each bar represents the number of values equal to the corresponding midpoint shown on the horizontal axis. Notice that both distributions are symmetric. @5 . a 2 1 0 4 5 6 7 B 9 10 (a) Estimate the mode, median, and mean for each histogram. (i) (ii) mode median mean (b) Which distribution has the larger standard deviation? Why? GD 5 S. 3 2 I 0 Distribution (i), because more of the data are farther from the mean. 0 Distribution (ii), because more of the data are farther from the mean. 0 Distribution (i), because more of the data are closer to the mean. 0 Distribution (ii), because more of the data are closer to the mean. Consider the following Minitab display of two data sets. Variable N Mean SE Mean StDeV Minimum Ql Median Q3 Maximum Cl 20 20.00 1.62 7.26 7.00 15.00 20.00 25.00 31.00 C2 20 20.00 1.30 5.79 7.00 20.00 22.00 22.00 31.00 (a) What are the respective means? The respective ranges? C1 C2 mean range (b) Which data set seems more symmetric? Why? 0 C2 seems more symmetric because the median is greater than the mean. 0 C1 seems more symmetric because the standard deviation is greater than the standard deviation for C2. 0 C1 seems more symmetric because the mean is equal to the median. 0 C2 seems more symmetric because the interquartile range is smaller than the interquartile range for C1. (c) Compare the interquartile ranges of the two sets. How do the middle halves of the data sets compare? 0 The C1 distribution has a larger interquartile range that is symmetric around the median. O The C2 distribution has a smaller interquartile range that is symmetric around the median. O The C1 distribution has a smaller interquartile range that is symmetric around the median. O The C2 distribution has a larger interquartile range that is symmetric around the median
Step by Step Solution
There are 3 Steps involved in it

Get step-by-step solutions from verified subject matter experts