

Question: Please help. This is my second time posting this question and the first response was incorrect. Thank you! The following is a control chart for
 Please help. This is my second time posting this question and the first response was incorrect. Thank you!
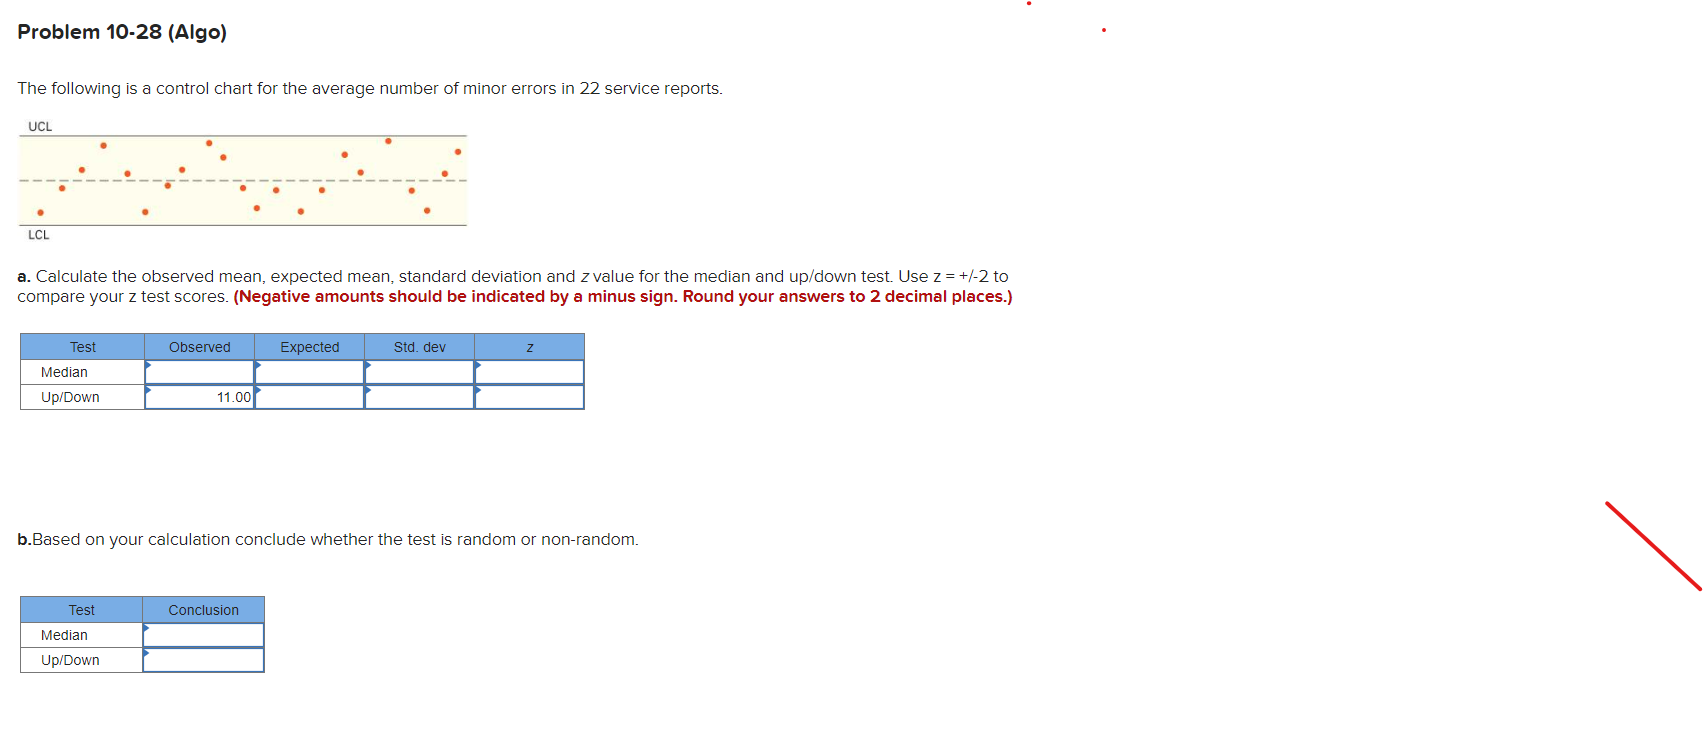
The following is a control chart for the average number of minor errors in 22 service reports. a. Calculate the observed mean, expected mean, standard deviation and z value for the median and up/down test. Use z=+/2 to compare your z test scores. (Negative amounts should be indicated by a minus sign. Round your answers to 2 decimal places.) b.Based on your calculation conclude whether the test is random or non-random
Step by Step Solution
There are 3 Steps involved in it
1 Expert Approved Answer
Step: 1 Unlock

Question Has Been Solved by an Expert!
Get step-by-step solutions from verified subject matter experts
Step: 2 Unlock
Step: 3 Unlock