

Question: Please help to finish this spreadsheet, to finish the spreadsheet, need to use Alphabet's 2017 10K filling sheet. Thank you so much! The 2014 financial
Please help to finish this spreadsheet, to finish the spreadsheet, need to use Alphabet's 2017 10K filling sheet. Thank you so much!
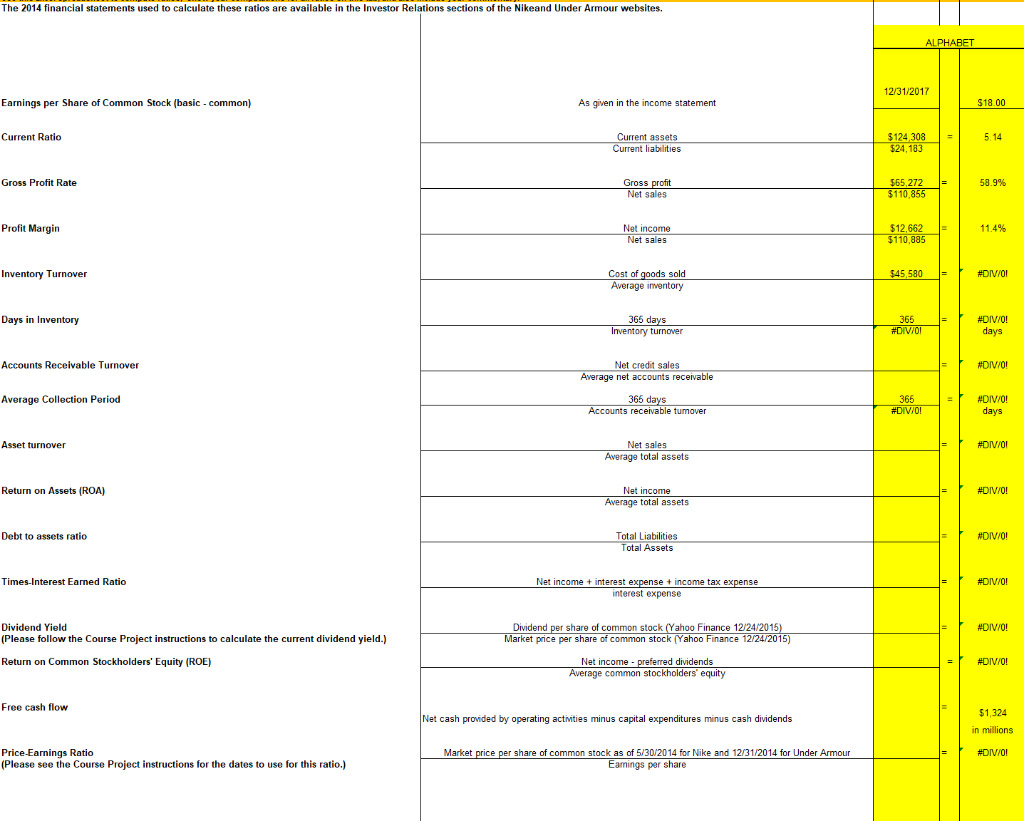
The 2014 financial statements used to calculate these ratios are available in the Investor Relations sections of the Nikeand Under Armour websites. ALPHABET 12/31/2017 Earnings per Share of Common Stock (basic-common) As given in the income statement $18.00 Current Ratio 5.14 Current assets Current liabilities $124,308 $24,183 Gross Profit Rate 58.9% Gross profit Net sales $65,272 $110,855 Profit Margin 11.4% Net income Net sales $12,662 $110.885 Inventory Turnover $45,580 #DIV/0! Cost of goods sold Average inventory Days in Inventory 365 days Inventory turnover 365 #DIV/01 #DIV/0! days Accounts Receivable Turnover #DIV/0! Net credit sales Average net accounts receivable Average Collection Period 365 days Accounts receivable tumover 365 #DIV/0! #DIV/0! days Asset turnover #DIV/0! Net sales Average total assets Return on Assets (ROA) #DIV/0! Net income Average total assets Debt to assets ratio Total Liabilities Total Assets #DIV/0! Times Interest Eamed Ratio #DIV/0! Net income + interest expense + income tax expense interest expense #DIV/0! Dividend Yield (Please follow the Course Project instructions to calculate the current dividend yield.) Dividend per share of common stock (Yahoo Finance 12/24/2015) Market price per share of common stock (Yahoo Finance 12/24/2015) Net income - preferred dividends Average common stockholders' equity Return on Common Stockholders' Equity (ROE) #DIV/0! Free cash flow Net cash provided by operating activities minus capital expenditures minus cash dividends $1,324 in millions #DIV/0! Price-Earnings Ratio (Please see the Course Project instructions for the dates to use for this ratio.) Market price per share of common stock as of 5/30/2014 for Nike and 12/31/2014 for Under Armour Eamings per share The 2014 financial statements used to calculate these ratios are available in the Investor Relations sections of the Nikeand Under Armour websites. ALPHABET 12/31/2017 Earnings per Share of Common Stock (basic-common) As given in the income statement $18.00 Current Ratio 5.14 Current assets Current liabilities $124,308 $24,183 Gross Profit Rate 58.9% Gross profit Net sales $65,272 $110,855 Profit Margin 11.4% Net income Net sales $12,662 $110.885 Inventory Turnover $45,580 #DIV/0! Cost of goods sold Average inventory Days in Inventory 365 days Inventory turnover 365 #DIV/01 #DIV/0! days Accounts Receivable Turnover #DIV/0! Net credit sales Average net accounts receivable Average Collection Period 365 days Accounts receivable tumover 365 #DIV/0! #DIV/0! days Asset turnover #DIV/0! Net sales Average total assets Return on Assets (ROA) #DIV/0! Net income Average total assets Debt to assets ratio Total Liabilities Total Assets #DIV/0! Times Interest Eamed Ratio #DIV/0! Net income + interest expense + income tax expense interest expense #DIV/0! Dividend Yield (Please follow the Course Project instructions to calculate the current dividend yield.) Dividend per share of common stock (Yahoo Finance 12/24/2015) Market price per share of common stock (Yahoo Finance 12/24/2015) Net income - preferred dividends Average common stockholders' equity Return on Common Stockholders' Equity (ROE) #DIV/0! Free cash flow Net cash provided by operating activities minus capital expenditures minus cash dividends $1,324 in millions #DIV/0! Price-Earnings Ratio (Please see the Course Project instructions for the dates to use for this ratio.) Market price per share of common stock as of 5/30/2014 for Nike and 12/31/2014 for Under Armour Eamings per share
Step by Step Solution
There are 3 Steps involved in it

Get step-by-step solutions from verified subject matter experts