

Question: Please help to solve this problem with JAVA or R or python language Please download data from Iris.csv file or use this table sepal_length sepal_width
Please help to solve this problem with JAVA or R or python language
Please download data from Iris.csv file or use this table
| sepal_length | sepal_width | petal_length | petal_width | species |
| 5.1 | 3.5 | 1.4 | 0.2 | setosa |
| 4.9 | 3 | 1.4 | 0.2 | setosa |
| 4.7 | 3.2 | 1.3 | 0.2 | setosa |
| 4.6 | 3.1 | 1.5 | 0.2 | setosa |
| 5 | 3.6 | 1.4 | 0.2 | setosa |
| 5.4 | 3.9 | 1.7 | 0.4 | setosa |
| 4.6 | 3.4 | 1.4 | 0.3 | setosa |
| 5 | 3.4 | 1.5 | 0.2 | setosa |
| 4.4 | 2.9 | 1.4 | 0.2 | setosa |
| 4.9 | 3.1 | 1.5 | 0.1 | setosa |
| 5.4 | 3.7 | 1.5 | 0.2 | setosa |
| 4.8 | 3.4 | 1.6 | 0.2 | setosa |
| 4.8 | 3 | 1.4 | 0.1 | setosa |
| 4.3 | 3 | 1.1 | 0.1 | setosa |
| 5.8 | 4 | 1.2 | 0.2 | setosa |
| 5.7 | 4.4 | 1.5 | 0.4 | setosa |
| 5.4 | 3.9 | 1.3 | 0.4 | setosa |
| 5.1 | 3.5 | 1.4 | 0.3 | setosa |
| 5.7 | 3.8 | 1.7 | 0.3 | setosa |
The psuedo code is as follow, please help to implement in JAVA, R or python
% code will show the process to generate synthetic data. clear clc close all
weka_data = arffparser('read', 'iris.arff'); % load data provided by WEKA iris_data.X(1,:) = weka_data.sepallength.values; iris_data.X(2,:) = weka_data.sepalwidth.values; iris_data.X(3,:) = weka_data.petallength.values; iris_data.X(4,:) = weka_data.petalwidth.values; iris_data.y = [ones(1,50) ones(1,50).*2 ones(1,50).*3];
iris_class_1 = cov(iris_data.X(:,1:50)'); %rng(5),rnd_data = rand(4,100); % uses rng() for a seed to genrate the same %random values rnd_data = rand(4,100); rnd_data = iris_class_1*rnd_data;
iris_synthetic = [];
sepal_length_min = min(iris_data.X(1,1:50)); sepal_length_max = max(iris_data.X(1,1:50));
X = (rnd_data(1,:))'; [l, n] = size(X); Pmin = min(rnd_data(1,:)); Pmax = max(rnd_data(1,:)); a = sepal_length_min; b = sepal_length_max; X = ((X - Pmin)./(Pmax - Pmin)).*(b-a)+ a; iris_synthetic(1,:) = X'; sepal_width_min = min(iris_data.X(2,1:50)); sepal_width_max = max(iris_data.X(2,1:50));
X = (rnd_data(2,:))'; [l, n] = size(X); Pmin = min(rnd_data(2,:)); Pmax = max(rnd_data(2,:)); a = sepal_width_min; b = sepal_width_max; X = ((X - Pmin)./(Pmax - Pmin)).*(b-a)+ a; iris_synthetic(2,:) = X';
petal_length_min = min(iris_data.X(3,1:50)); petal_length_max = max(iris_data.X(3,1:50));
X = (rnd_data(3,:))'; [l, n] = size(X); Pmin = min(rnd_data(3,:)); Pmax = max(rnd_data(3,:)); a = petal_length_min; b = petal_length_max; X = ((X - Pmin)./(Pmax - Pmin)).*(b-a)+ a; iris_synthetic(3,:) = X';
petal_width_min = min(iris_data.X(4,1:50)); petal_width_max = max(iris_data.X(4,1:50));
X = (rnd_data(4,:))'; [l, n] = size(X); Pmin = min(rnd_data(4,:)); Pmax = max(rnd_data(4,:)); a = petal_width_min; b = petal_width_max; X = ((X - Pmin)./(Pmax - Pmin)).*(b-a)+ a; iris_synthetic(4,:) = X';
mu = (mean(iris_synthetic')-mean(iris_data.X(:,1:50)')); mu_100 = [ones(1,100)*mu(1); ones(1,100)*mu(2); ones(1,100)*mu(3); ones(1,100)*mu(4)]; tmp = iris_synthetic - mu_100;
figure(1),plot(iris_data.X(1,1:50),iris_data.X(4,1:50),'or') hold on; plot(tmp(1,:),tmp(4,:),'xb') p = findobj(gcf,'Type','line'); set(p,'LineWidth',3); axis([4 6 0 0.65]) hold off;
figure(2); hold on; ID.X = tmp([1 4],:); ID.y = ones(1,100); ppatterns(ID); model = mlcgmm(ID); % ML estimate of GMM pgauss(model); pgmm(model,struct('visual','contour'));
ID.X = iris_data.X([1 4],1:50); ID.y = iris_data.y(51:100); ppatterns(ID); model = mlcgmm(ID); % ML estimate of GMM pgauss(model); pgmm(model,struct('visual','contour')); p = findobj(gcf,'Type','line'); set(p,'LineWidth',3); axis([4 6 0 0.65])
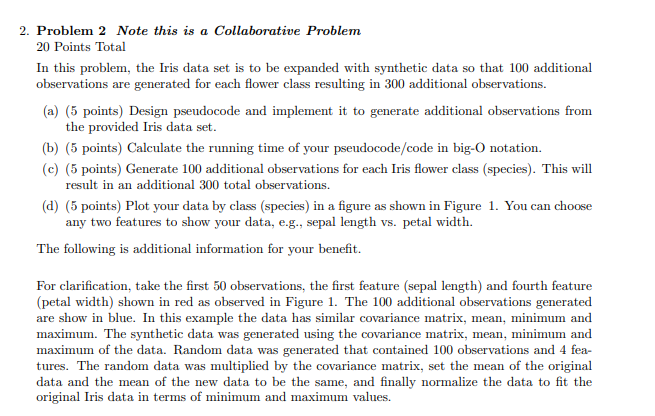
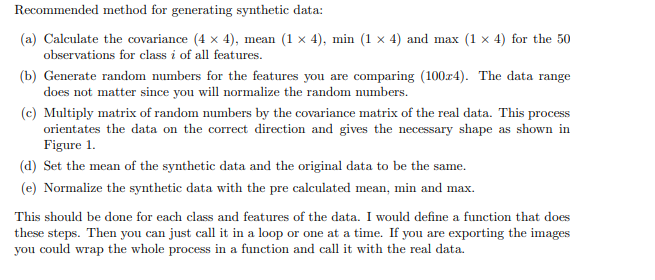
2. Problem 2 Note this is a collaborative Problem 20 Points Total In this problem, the Iris data set is to be expanded with synthetic data so that 100 additional observations are generated for each flower class resulting in 300 additional observations. (a) (5 points) Design pseudocode and implement it to generate additional observations from the provided Iris data set. (b) (5 points) Calculate the running time of your pseudocode/code in big-O notation. (c) (5 points) Generate 100 additional observations for each Iris flower class (species). This will result in an additional 300 total observations. (d) (5 points) Plot your data by class (species) in a figure as shown in Figure 1. You can choose any two features to show your data, e.g., sepal length vs. petal width. The following is additional information for your benefit. For clarification, take the first 50 observations, the first feature (sepal length) and fourth feature (petal width) shown in red as observed in Figure 1. The 100 additional observations generated are show in blue. In this example the data has similar covariance matrix, mean, minimum and maximum. The synthetic data was generated using the covariance matrix, mean, minimum and maximum of the data. Random data was generated that contained 100 observations and 4 fea- tures. The random data was multiplied by the covariance matrix, set the mean of the original data and the mean of the new data to be the same, and finally normalize the data to fit the original Iris data in terms of minimum and maximum values. Recommended method for generating synthetic data: (a) Calculate the covariance (4 x 4), mean (1 x 4), min (1 x 4) and max (1 x 4) for the 50 observations for class i of all features. (b) Generate random numbers for the features you are comparing (100z4). The data range does not matter since you will normalize the random numbers. (c) Multiply matrix of random numbers by the covariance matrix of the real data. This process orientates the data on the correct direction and gives the necessary shape as shown in Figure 1. (d) Set the mean of the synthetic data and the original data to be the same. (e) Normalize the synthetic data with the pre calculated mean, min and max. This should be done for each class and features of the data. I would define a function that does these steps. Then you can just call it in a loop or one at a time. If you are exporting the images you could wrap the whole process in a function and call it with the real data. 2. Problem 2 Note this is a collaborative Problem 20 Points Total In this problem, the Iris data set is to be expanded with synthetic data so that 100 additional observations are generated for each flower class resulting in 300 additional observations. (a) (5 points) Design pseudocode and implement it to generate additional observations from the provided Iris data set. (b) (5 points) Calculate the running time of your pseudocode/code in big-O notation. (c) (5 points) Generate 100 additional observations for each Iris flower class (species). This will result in an additional 300 total observations. (d) (5 points) Plot your data by class (species) in a figure as shown in Figure 1. You can choose any two features to show your data, e.g., sepal length vs. petal width. The following is additional information for your benefit. For clarification, take the first 50 observations, the first feature (sepal length) and fourth feature (petal width) shown in red as observed in Figure 1. The 100 additional observations generated are show in blue. In this example the data has similar covariance matrix, mean, minimum and maximum. The synthetic data was generated using the covariance matrix, mean, minimum and maximum of the data. Random data was generated that contained 100 observations and 4 fea- tures. The random data was multiplied by the covariance matrix, set the mean of the original data and the mean of the new data to be the same, and finally normalize the data to fit the original Iris data in terms of minimum and maximum values. Recommended method for generating synthetic data: (a) Calculate the covariance (4 x 4), mean (1 x 4), min (1 x 4) and max (1 x 4) for the 50 observations for class i of all features. (b) Generate random numbers for the features you are comparing (100z4). The data range does not matter since you will normalize the random numbers. (c) Multiply matrix of random numbers by the covariance matrix of the real data. This process orientates the data on the correct direction and gives the necessary shape as shown in Figure 1. (d) Set the mean of the synthetic data and the original data to be the same. (e) Normalize the synthetic data with the pre calculated mean, min and max. This should be done for each class and features of the data. I would define a function that does these steps. Then you can just call it in a loop or one at a time. If you are exporting the images you could wrap the whole process in a function and call it with the real data
Step by Step Solution
There are 3 Steps involved in it

Get step-by-step solutions from verified subject matter experts