

Question: please help! U.S. CAPITAL MARKETS TOTAL ANNUAL RETURNS, 1990-2015 Arithmetic Geometric Standard Deviation of Investment Category Mean Mean Return Common stocks 10.52% 9.11% 18.9% Treasury
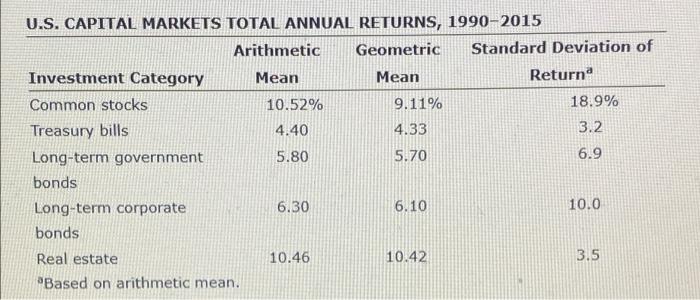

U.S. CAPITAL MARKETS TOTAL ANNUAL RETURNS, 1990-2015 Arithmetic Geometric Standard Deviation of Investment Category Mean Mean Return Common stocks 10.52% 9.11% 18.9% Treasury bills 4.40 4.33 3.2 Long-term government 5.80 5.70 6.9 bonds Long-term corporate 6.30 6.10 10.0 bonds Real estate 10.46 10.42 3.5 Based on arithmetic mean. 3. Explain why the geoment and are mean returns are not equal and whether one or the other may be more useful for investment decision making The arithmetic average sumes while the geometric average ames for the time period indicated, tank these investments on a relative aussing the cont of variation from motto lenit durable. Do not found intermediate raketon Round your anners to two decal places Rank Investment Category Coefficient of variation, 1 2 4 5 At the man returns into a tre Calculate the range of runs that we wted to the hogy mermediate action Hound your answers to come to Mr
Step by Step Solution
There are 3 Steps involved in it

Get step-by-step solutions from verified subject matter experts