

Question: please help us get the forecast sales for the first 4 months in 2019 and walk through the steps please Richard has been hired by
please help us get the forecast sales for the first 4 months in 2019 and walk through the steps please
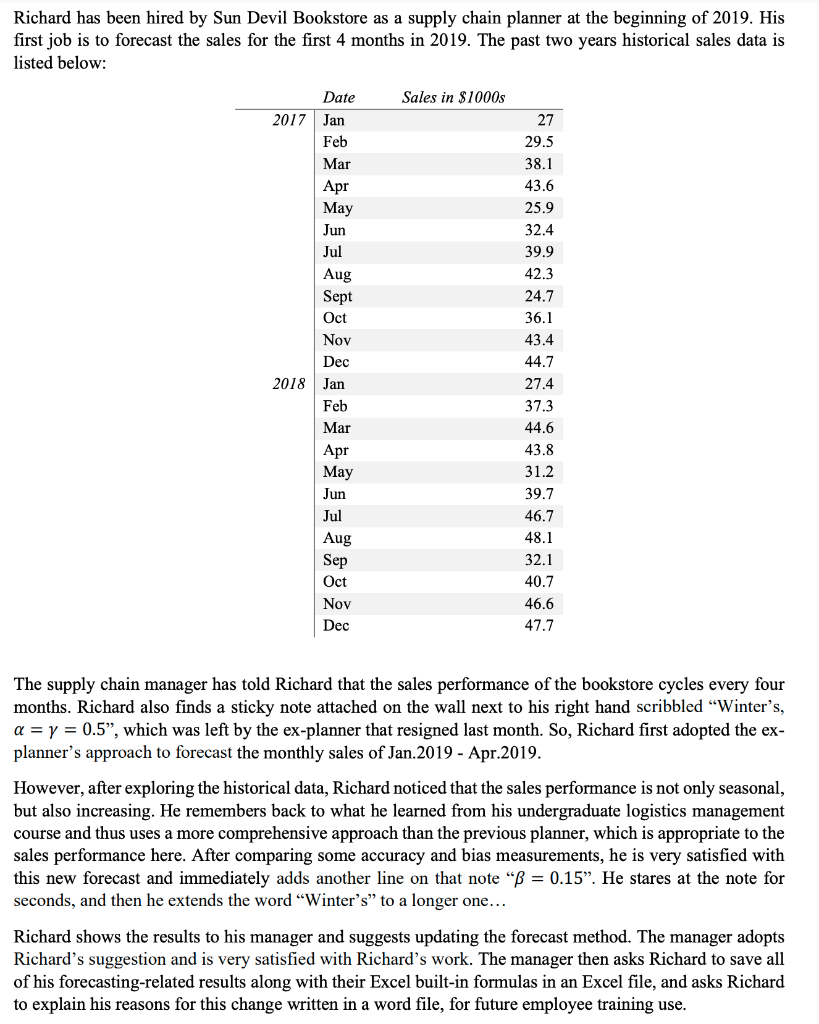
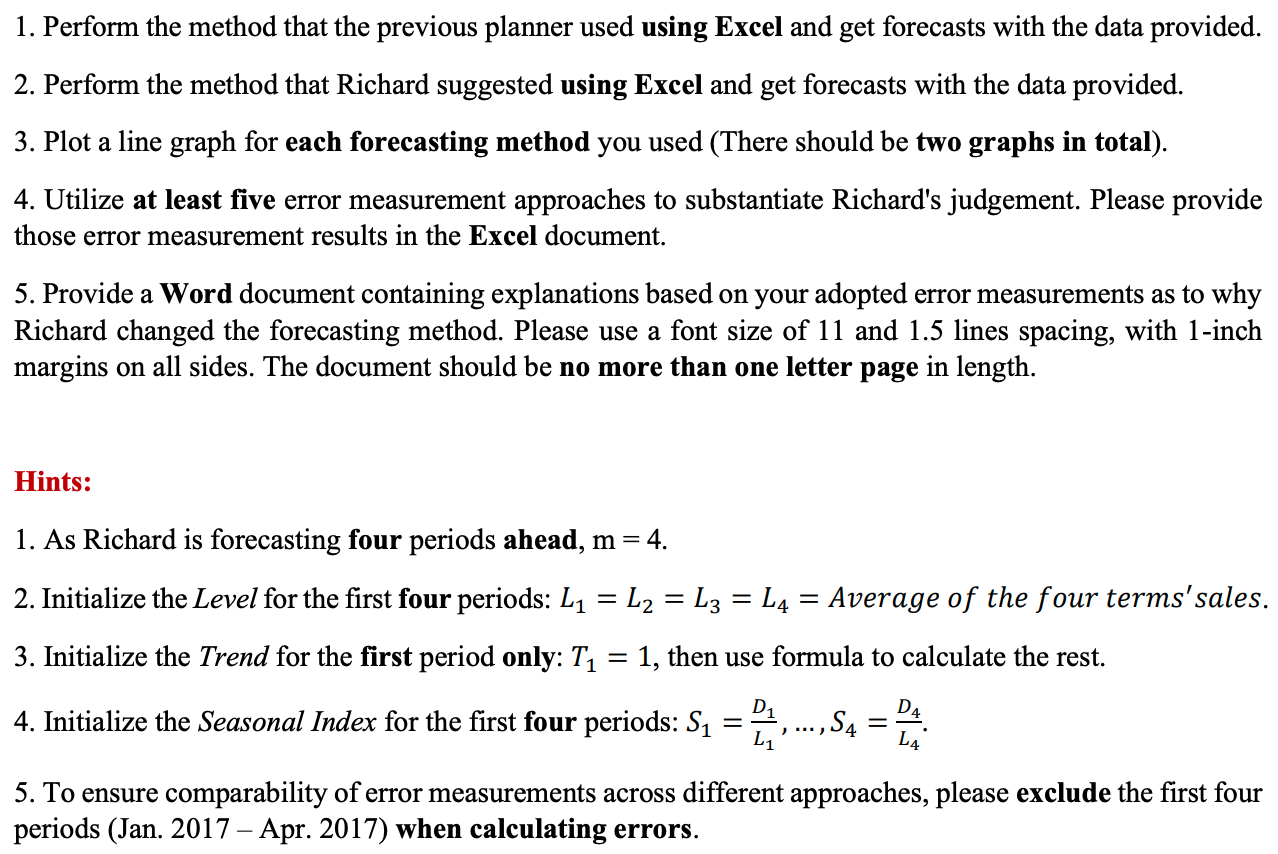
Richard has been hired by Sun Devil Bookstore as a supply chain planner at the beginning of 2019 . His first job is to forecast the sales for the first 4 months in 2019 . The past two years historical sales data is listed below: The supply chain manager has told Richard that the sales performance of the bookstore cycles every four months. Richard also finds a sticky note attached on the wall next to his right hand scribbled "Winter's, ==0.5 ", which was left by the ex-planner that resigned last month. So, Richard first adopted the explanner's approach to forecast the monthly sales of Jan.2019 - Apr.2019. However, after exploring the historical data, Richard noticed that the sales performance is not only seasonal, but also increasing. He remembers back to what he learned from his undergraduate logistics management course and thus uses a more comprehensive approach than the previous planner, which is appropriate to the sales performance here. After comparing some accuracy and bias measurements, he is very satisfied with this new forecast and immediately adds another line on that note " =0.15 ". He stares at the note for seconds, and then he extends the word "Winter's" to a longer one... Richard shows the results to his manager and suggests updating the forecast method. The manager adopts Richard's suggestion and is very satisfied with Richard's work. The manager then asks Richard to save all of his forecasting-related results along with their Excel built-in formulas in an Excel file, and asks Richard to explain his reasons for this change written in a word file, for future employee training use. 1. Perform the method that the previous planner used using Excel and get forecasts with the data provided. 2. Perform the method that Richard suggested using Excel and get forecasts with the data provided. 3. Plot a line graph for each forecasting method you used (There should be two graphs in total). 4. Utilize at least five error measurement approaches to substantiate Richard's judgement. Please provide those error measurement results in the Excel document. 5. Provide a Word document containing explanations based on your adopted error measurements as to why Richard changed the forecasting method. Please use a font size of 11 and 1.5 lines spacing, with 1-inch margins on all sides. The document should be no more than one letter page in length. Hints: 1. As Richard is forecasting four periods ahead, m=4. 2. Initialize the Level for the first four periods: L1=L2=L3=L4= Average of the four terms'sales. 3. Initialize the Trend for the first period only: T1=1, then use formula to calculate the rest. 4. Initialize the Seasonal Index for the first four periods: S1=L1D1,,S4=L4D4. 5. To ensure comparability of error measurements across different approaches, please exclude the first four periods (Jan. 2017 - Apr. 2017) when calculating errors
Step by Step Solution
There are 3 Steps involved in it

Get step-by-step solutions from verified subject matter experts