

Question: Please help Use a graphing calculator to find a linear regression model for the men's 100-meter freestyle 100-Meter Freestyle data given in the table on
Please help
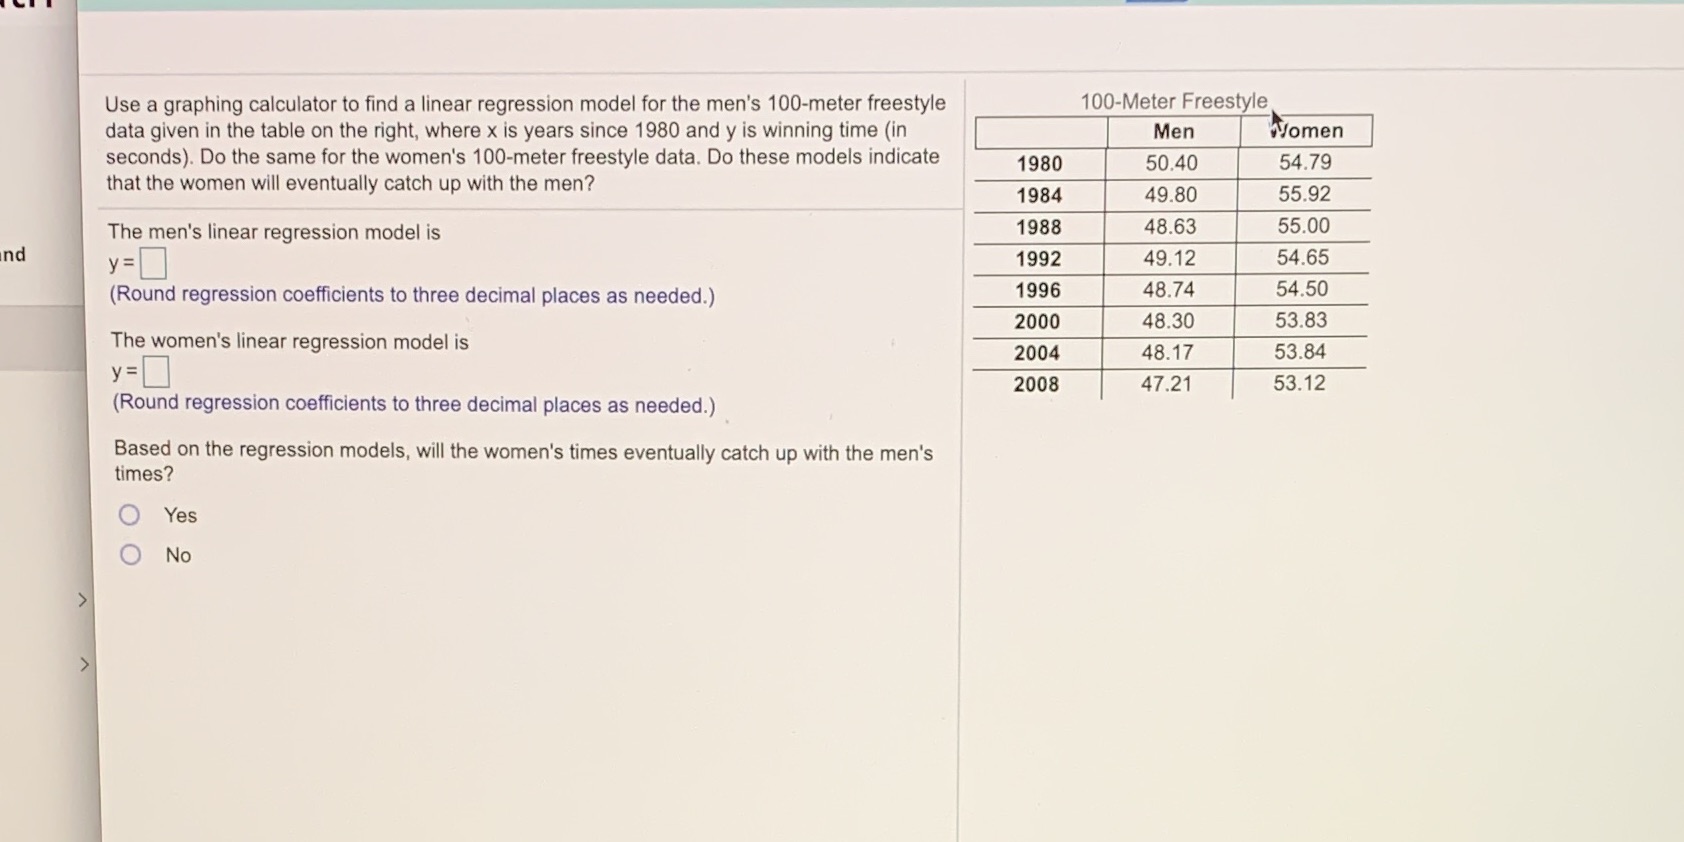
Use a graphing calculator to find a linear regression model for the men's 100-meter freestyle 100-Meter Freestyle data given in the table on the right, where x is years since 1980 and y is winning time (in Men Women seconds). Do the same for the women's 100-meter freestyle data. Do these models indicate 1980 50.40 54.79 that the women will eventually catch up with the men? 1984 49.80 55.92 The men's linear regression model is 1988 48.63 55.00 nd y = 0 1992 49.12 54.65 (Round regression coefficients to three decimal places as needed.) 1996 48.74 54.50 2000 48.30 53.83 The women's linear regression model is 2004 48.17 53.84 y =0 2008 47.21 53.12 (Round regression coefficients to three decimal places as needed.) Based on the regression models, will the women's times eventually catch up with the men's times? Yes O No
Step by Step Solution
There are 3 Steps involved in it

Get step-by-step solutions from verified subject matter experts