

Question: please help Use this graph for the next two questions. Cost Revenue Price Q2 Q1 Q3 Q 35. In the above diagram, output level Q1
please help

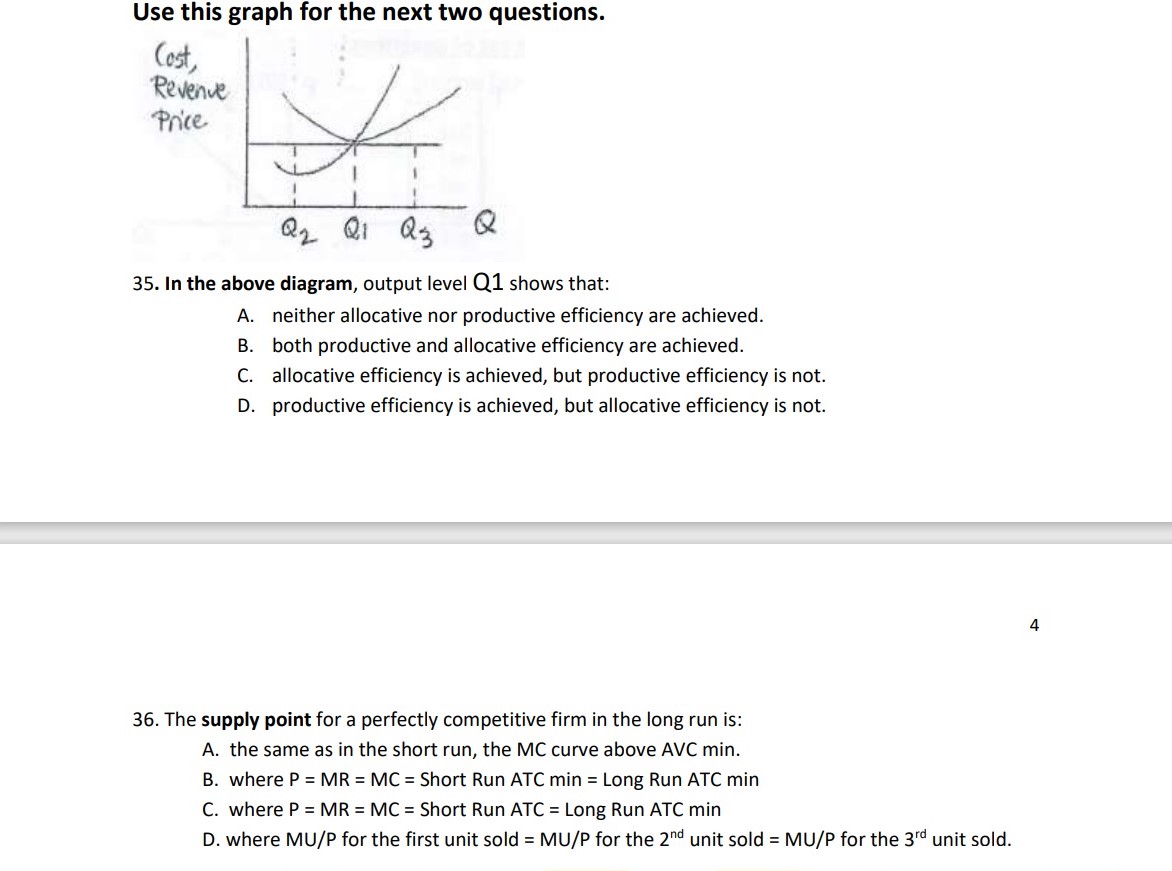
Use this graph for the next two questions. Cost Revenue Price Q2 Q1 Q3 Q 35. In the above diagram, output level Q1 shows that: A. neither allocationor productive efficiency are achieved. B. both productive and allocation efficiency are achieved. C. allocation efficiency is achieved, but productive efficiency is not. D. productive efficiency is achieved, but allocation efficiency is not. 36. The supply point for a perfectly competitive firm in the long run is: A. the same as in the short run, the MC curve above AVC min. B. where P = MR = MC = Short Run ATC min = Long Run ATC min C. where P = MR = MC = Short Run ATC = Long Run ATC min D. where MU/P for the first unit sold = MU/P for the 2nd unit sold = MU/P for the 3"d unit sold
Step by Step Solution
There are 3 Steps involved in it

Get step-by-step solutions from verified subject matter experts