

Question: Please help. using MatLab 3.1 Write a script that creates six sub-plots in two columns each with three rows. Each plot should have an appropriate
Please help. using MatLab
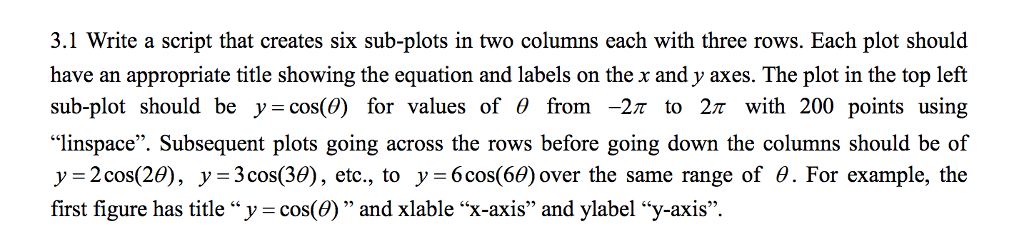
3.1 Write a script that creates six sub-plots in two columns each with three rows. Each plot should have an appropriate title showing the equation and labels on the x and y axes. The plot in the top left sub-plot should be cos(0) for values of from-2 to 2 with 200 points using "linspace". Subsequent plots going across the rows before going down the columns should be of y: 2 cos(29), y-3 cos(39), etc., to y-s(60) over the same range of 69. For example, the COS ab el "y-axis
Step by Step Solution
There are 3 Steps involved in it
1 Expert Approved Answer
Step: 1 Unlock

Question Has Been Solved by an Expert!
Get step-by-step solutions from verified subject matter experts
Step: 2 Unlock
Step: 3 Unlock