

Question: Please help !! Will A convenience store recently started to carry a new brand of soft drink. Management is interested in estimating future sales volume
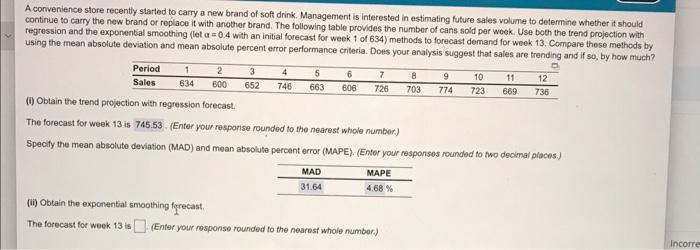
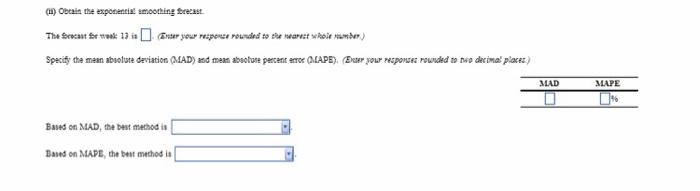
A convenience store recently started to carry a new brand of soft drink. Management is interested in estimating future sales volume to determine whether it should continue to carry the new brand or replace it with another brand. The following table provides the number of cans sold per week. Use both the trend projection with regression and the exponential smoothing (let a=0.4 with an initial forecast for week 1 of 634) methods to forecast demand for week 13. Compare these methods by using the mean absolute deviation and mean absolute percent error performance criteria. Does your analysis suggest that sales are trending and if so, by how much? Period 1 634 Sales 2 600 3 4 5 652 746 663 6 606 MAD 31.64 7 726 (i) Obtain the trend projection with regression forecast. The forecast for week 13 is 745.53 (Enter your response rounded to the nearest whole number.) Specify the mean absolute deviation (MAD) and mean absolute percent error (MAPE). (Enter your responses rounded to two decimal places.) MAPE 4.68 % 8 10 11 9 703 774 723 669 (ii) Obtain the exponential smoothing forecast. The forecast for week 13 is (Enter your response rounded to the nearest whole number.) 12 736 Incorres (1) Obtain the exponential smoothing forecast The Srecast for week 13 ister your response rounded to the nearest le number) Specify the mean absolute deviation (MAD) and mean absolute percent error (MAPE). (Euter your responses rounded to two decimal places) Based on MAD, the best method is Based on MAPE, the best method is MAD MAPE
Step by Step Solution
There are 3 Steps involved in it

Get step-by-step solutions from verified subject matter experts