

Question: Please help with #19 the table is shown above. Thank you. BHP Billiton LVMH BP 1.00 Siemens 0.19 1.00 Nestl -0.11 0.32 1.00 0.22 0.52
Please help with #19 the table is shown above. Thank you.
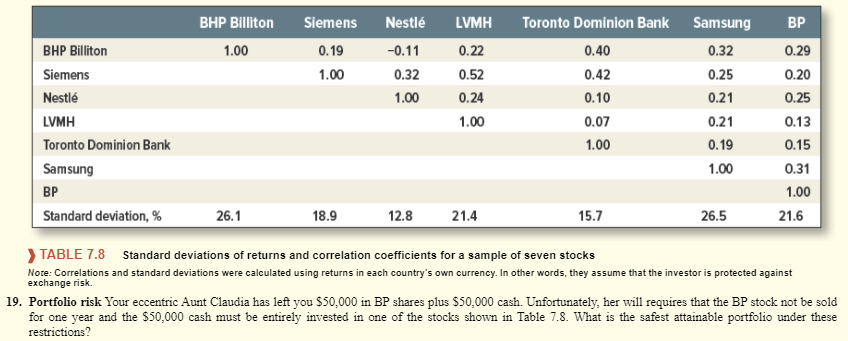
BHP Billiton LVMH BP 1.00 Siemens 0.19 1.00 Nestl -0.11 0.32 1.00 0.22 0.52 0.24 1.00 BHP Billiton Siemens Nestl LVMH Toronto Dominion Bank Samsung BP Standard deviation, % Toronto Dominion Bank 0.40 0.42 0.10 0.07 1.00 Samsung 0.32 0.25 0.21 0.21 0.19 1.00 0.29 0.20 0.25 0.13 0.15 0.31 1.00 21.6 26.1 18.9 12.8 21.4 15.7 26.5 > TABLE 7.8 Standard deviations of returns and correlation coefficients for a sample of seven stocks Nore: Correlations and standard deviations were calculated using returns in each country's own currency. In other words, they assume that the investor is protected against 19. Portfolio risk Your eccentric Aunt Claudia has left you $50,000 in BP shares plus $50,000 cash. Unfortunately, her will requires that the BP stock not be sold for one year and the $50,000 cash must be entirely invested in one of the stocks shown in Table 7.8. What is the safest attainable portfolio under these exchange risk restrictions
Step by Step Solution
There are 3 Steps involved in it

Get step-by-step solutions from verified subject matter experts