

Question: Please help with 6.1, 6.36, and 6.38. I do not need 6.37 but just have to use the chart from that 6-1. The data that
Please help with 6.1, 6.36, and 6.38. I do not need 6.37 but just have to use the chart from that
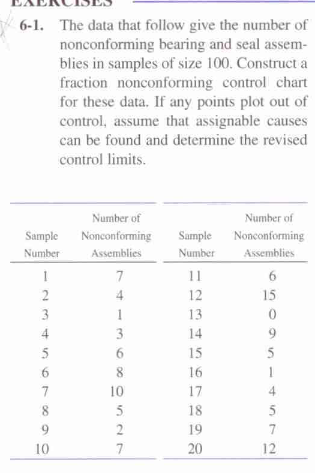
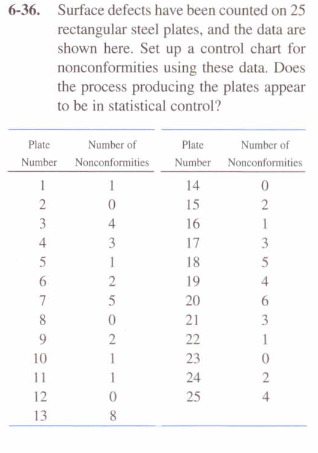
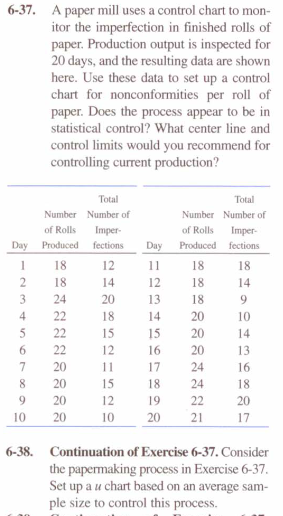
6-1. The data that follow give the number of nonconforming bearing and seal assemblies in samples of size 100. Construct a fraction nonconforming control chart for these data. If any points plot out of control, assume that assignable causes can be found and determine the revised control limits. 6-36. Surface defects have been counted on 25 rectangular steel plates, and the data are shown here. Set up a control chart for nonconformities using these data. Does the process producing the plates appear to be in statistical control? 6-37. A paper mill uses a control chart to monitor the imperfection in finished rolls of paper. Production output is inspected for 20 days, and the resulting data are shown here. Use these data to set up a control chart for nonconformities per roll of paper. Does the process appear to be in statistical control? What center line and control limits would you recommend for controlling current production? 6-38. Continuation of Exercise 6-37. Consider the papermaking process in Exercise 6-37. Set up a u chart based on an average sample size to control this process
Step by Step Solution
There are 3 Steps involved in it

Get step-by-step solutions from verified subject matter experts