

Question: please help with 7 ae- 11 a-e 7. [-/16 Points] DETAILS BBBASICSTAT8 9.3.010.MI. MY NOTES Women athletes at a certain university have a long-term graduation
please help with 7 ae- 11 a-e
![please help with 7 ae- 11 a-e 7. [-/16 Points] DETAILS BBBASICSTAT8](https://dsd5zvtm8ll6.cloudfront.net/si.experts.images/questions/2024/10/671119327f496_8106711193243e7c.jpg)
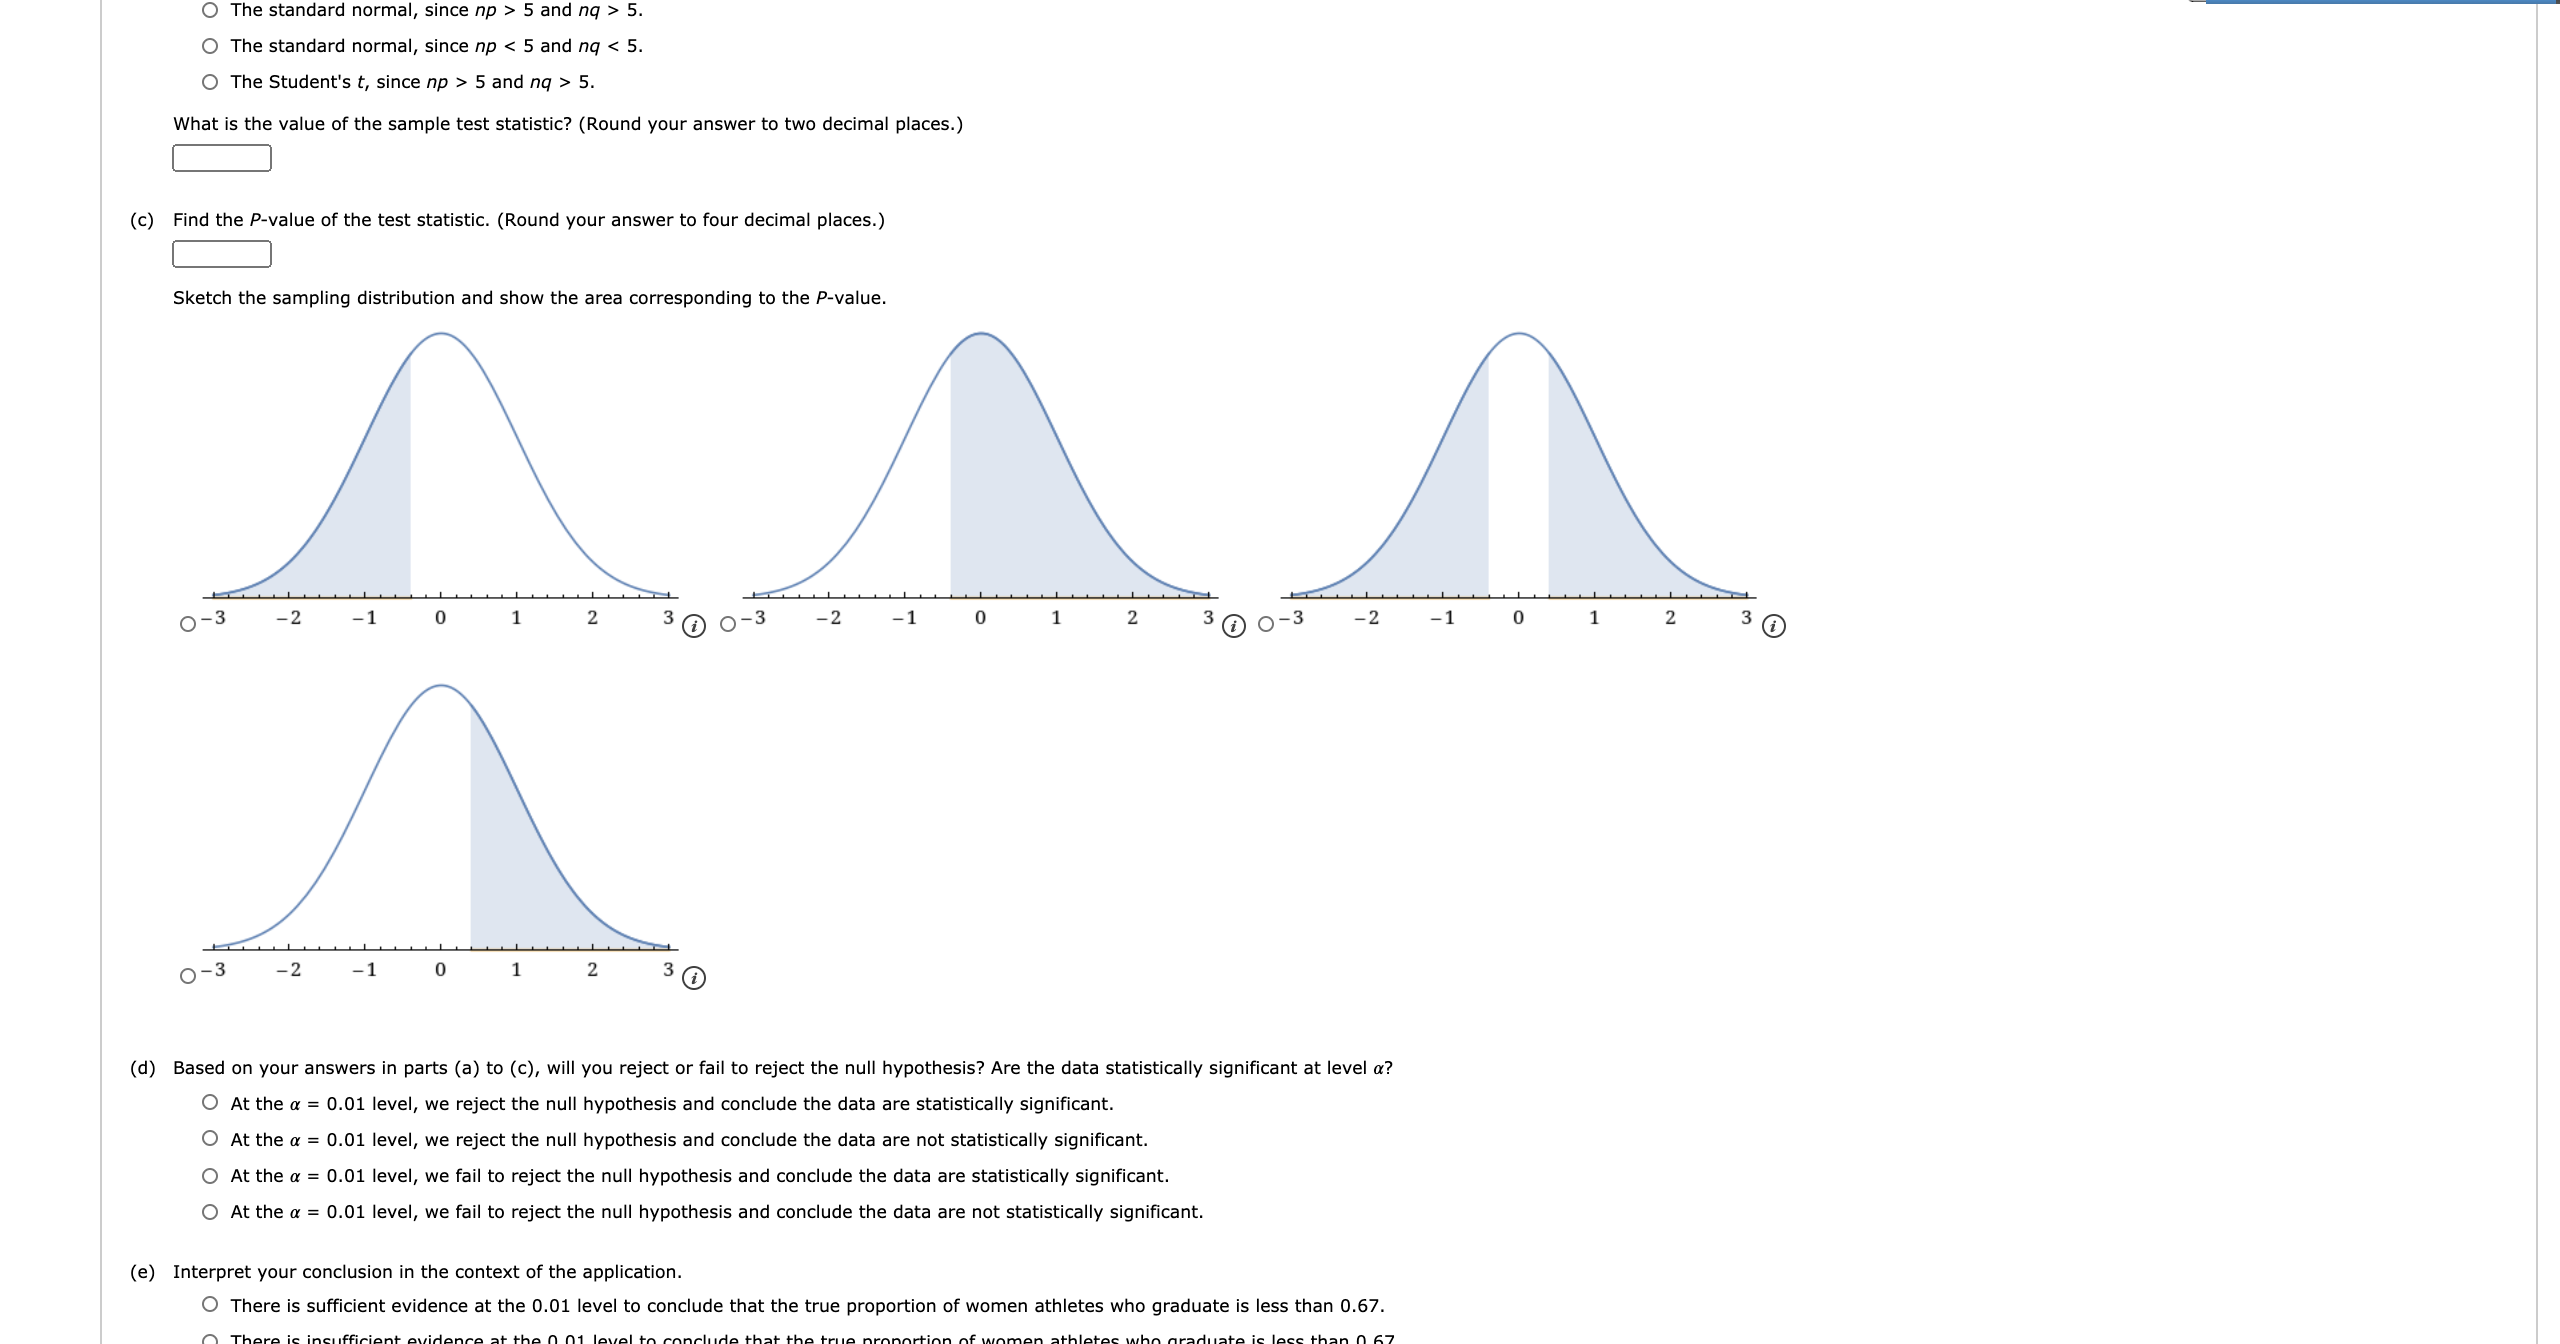
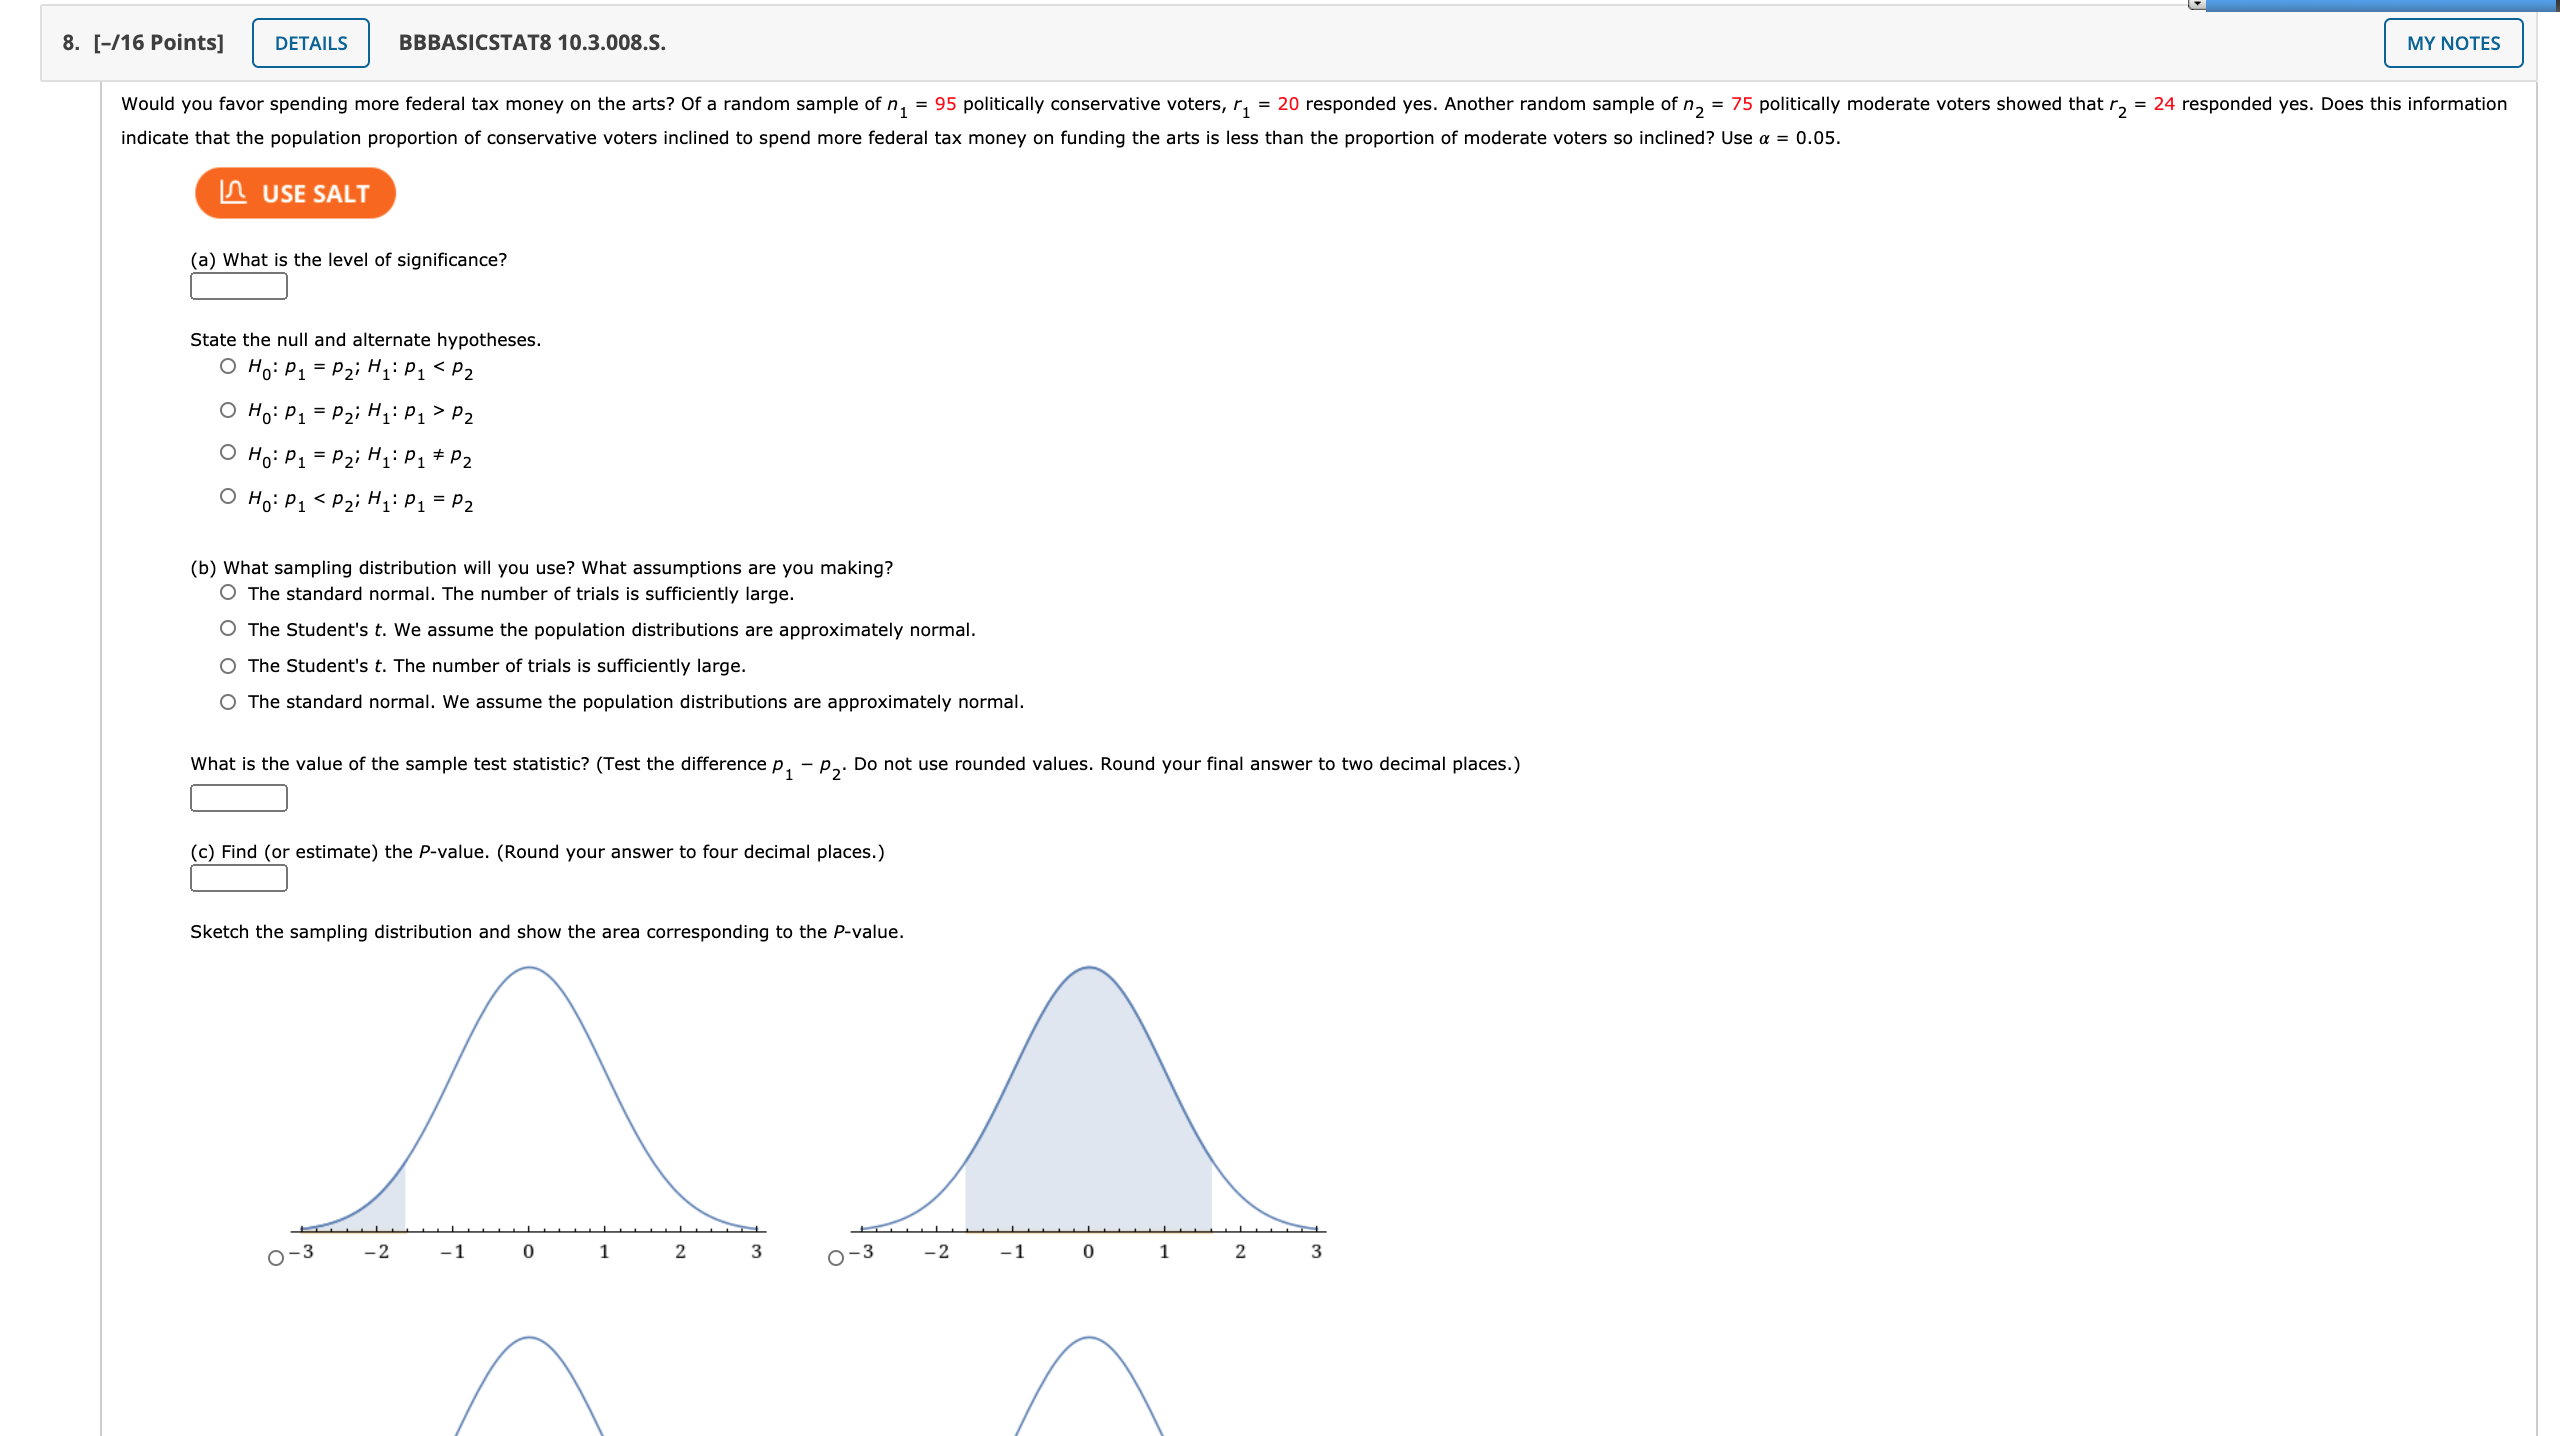
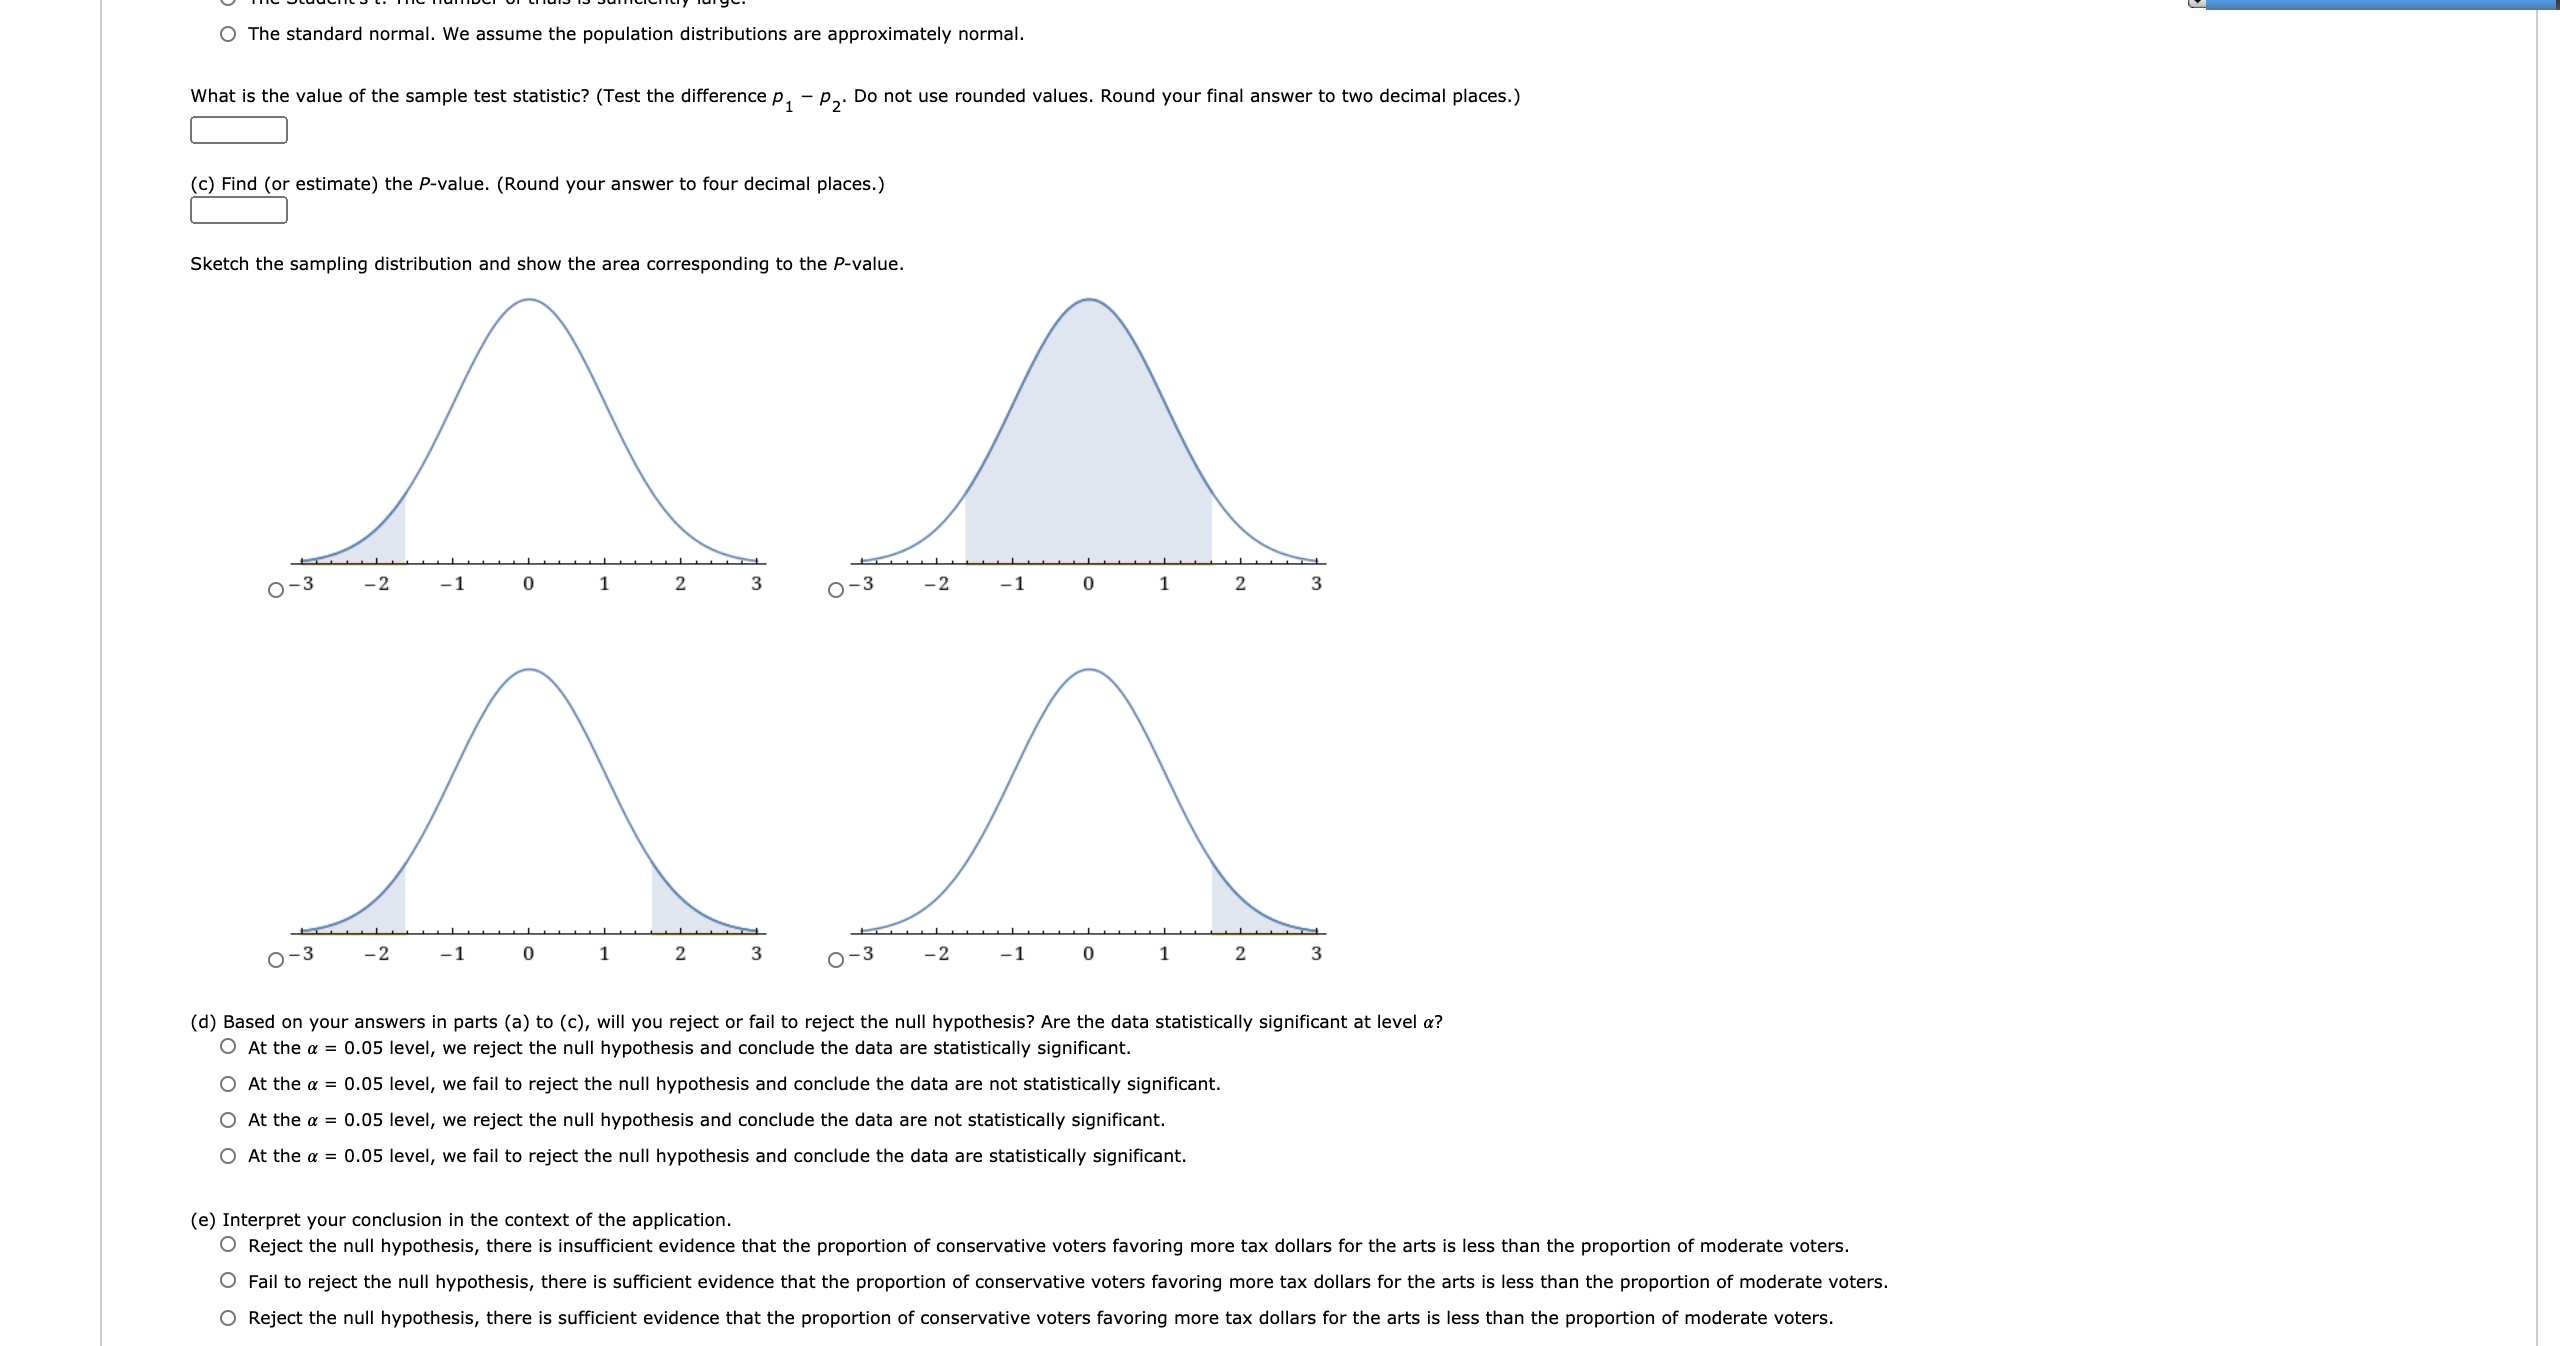
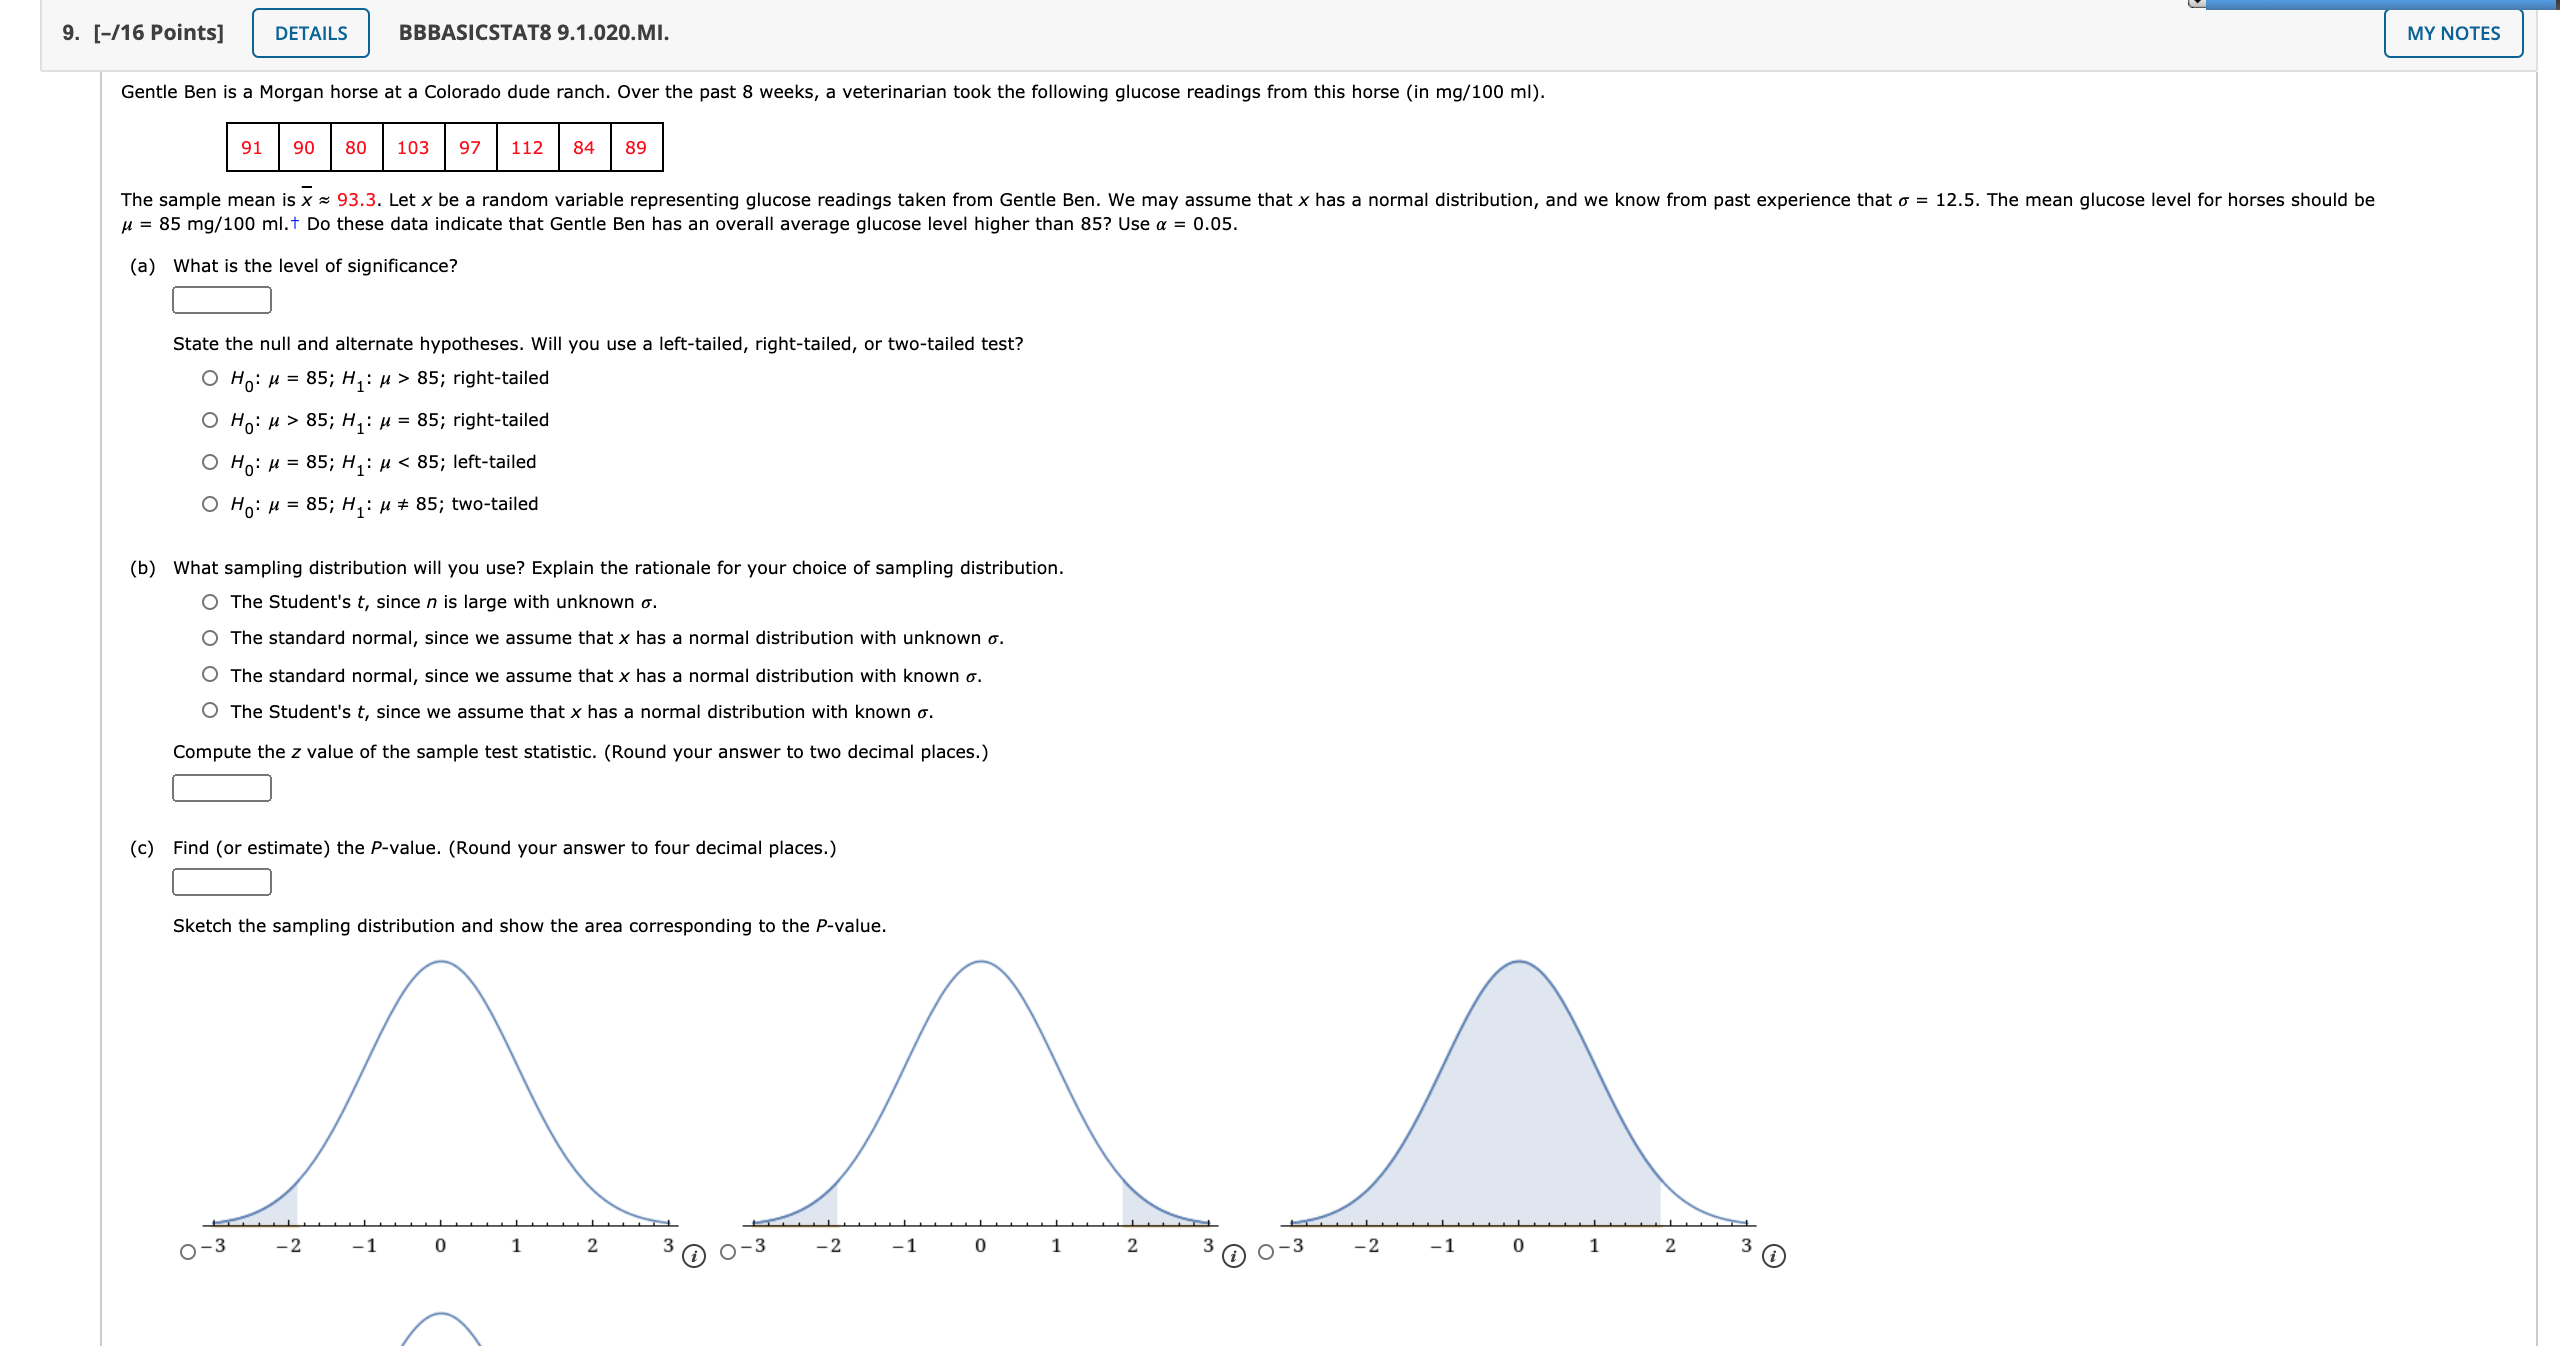
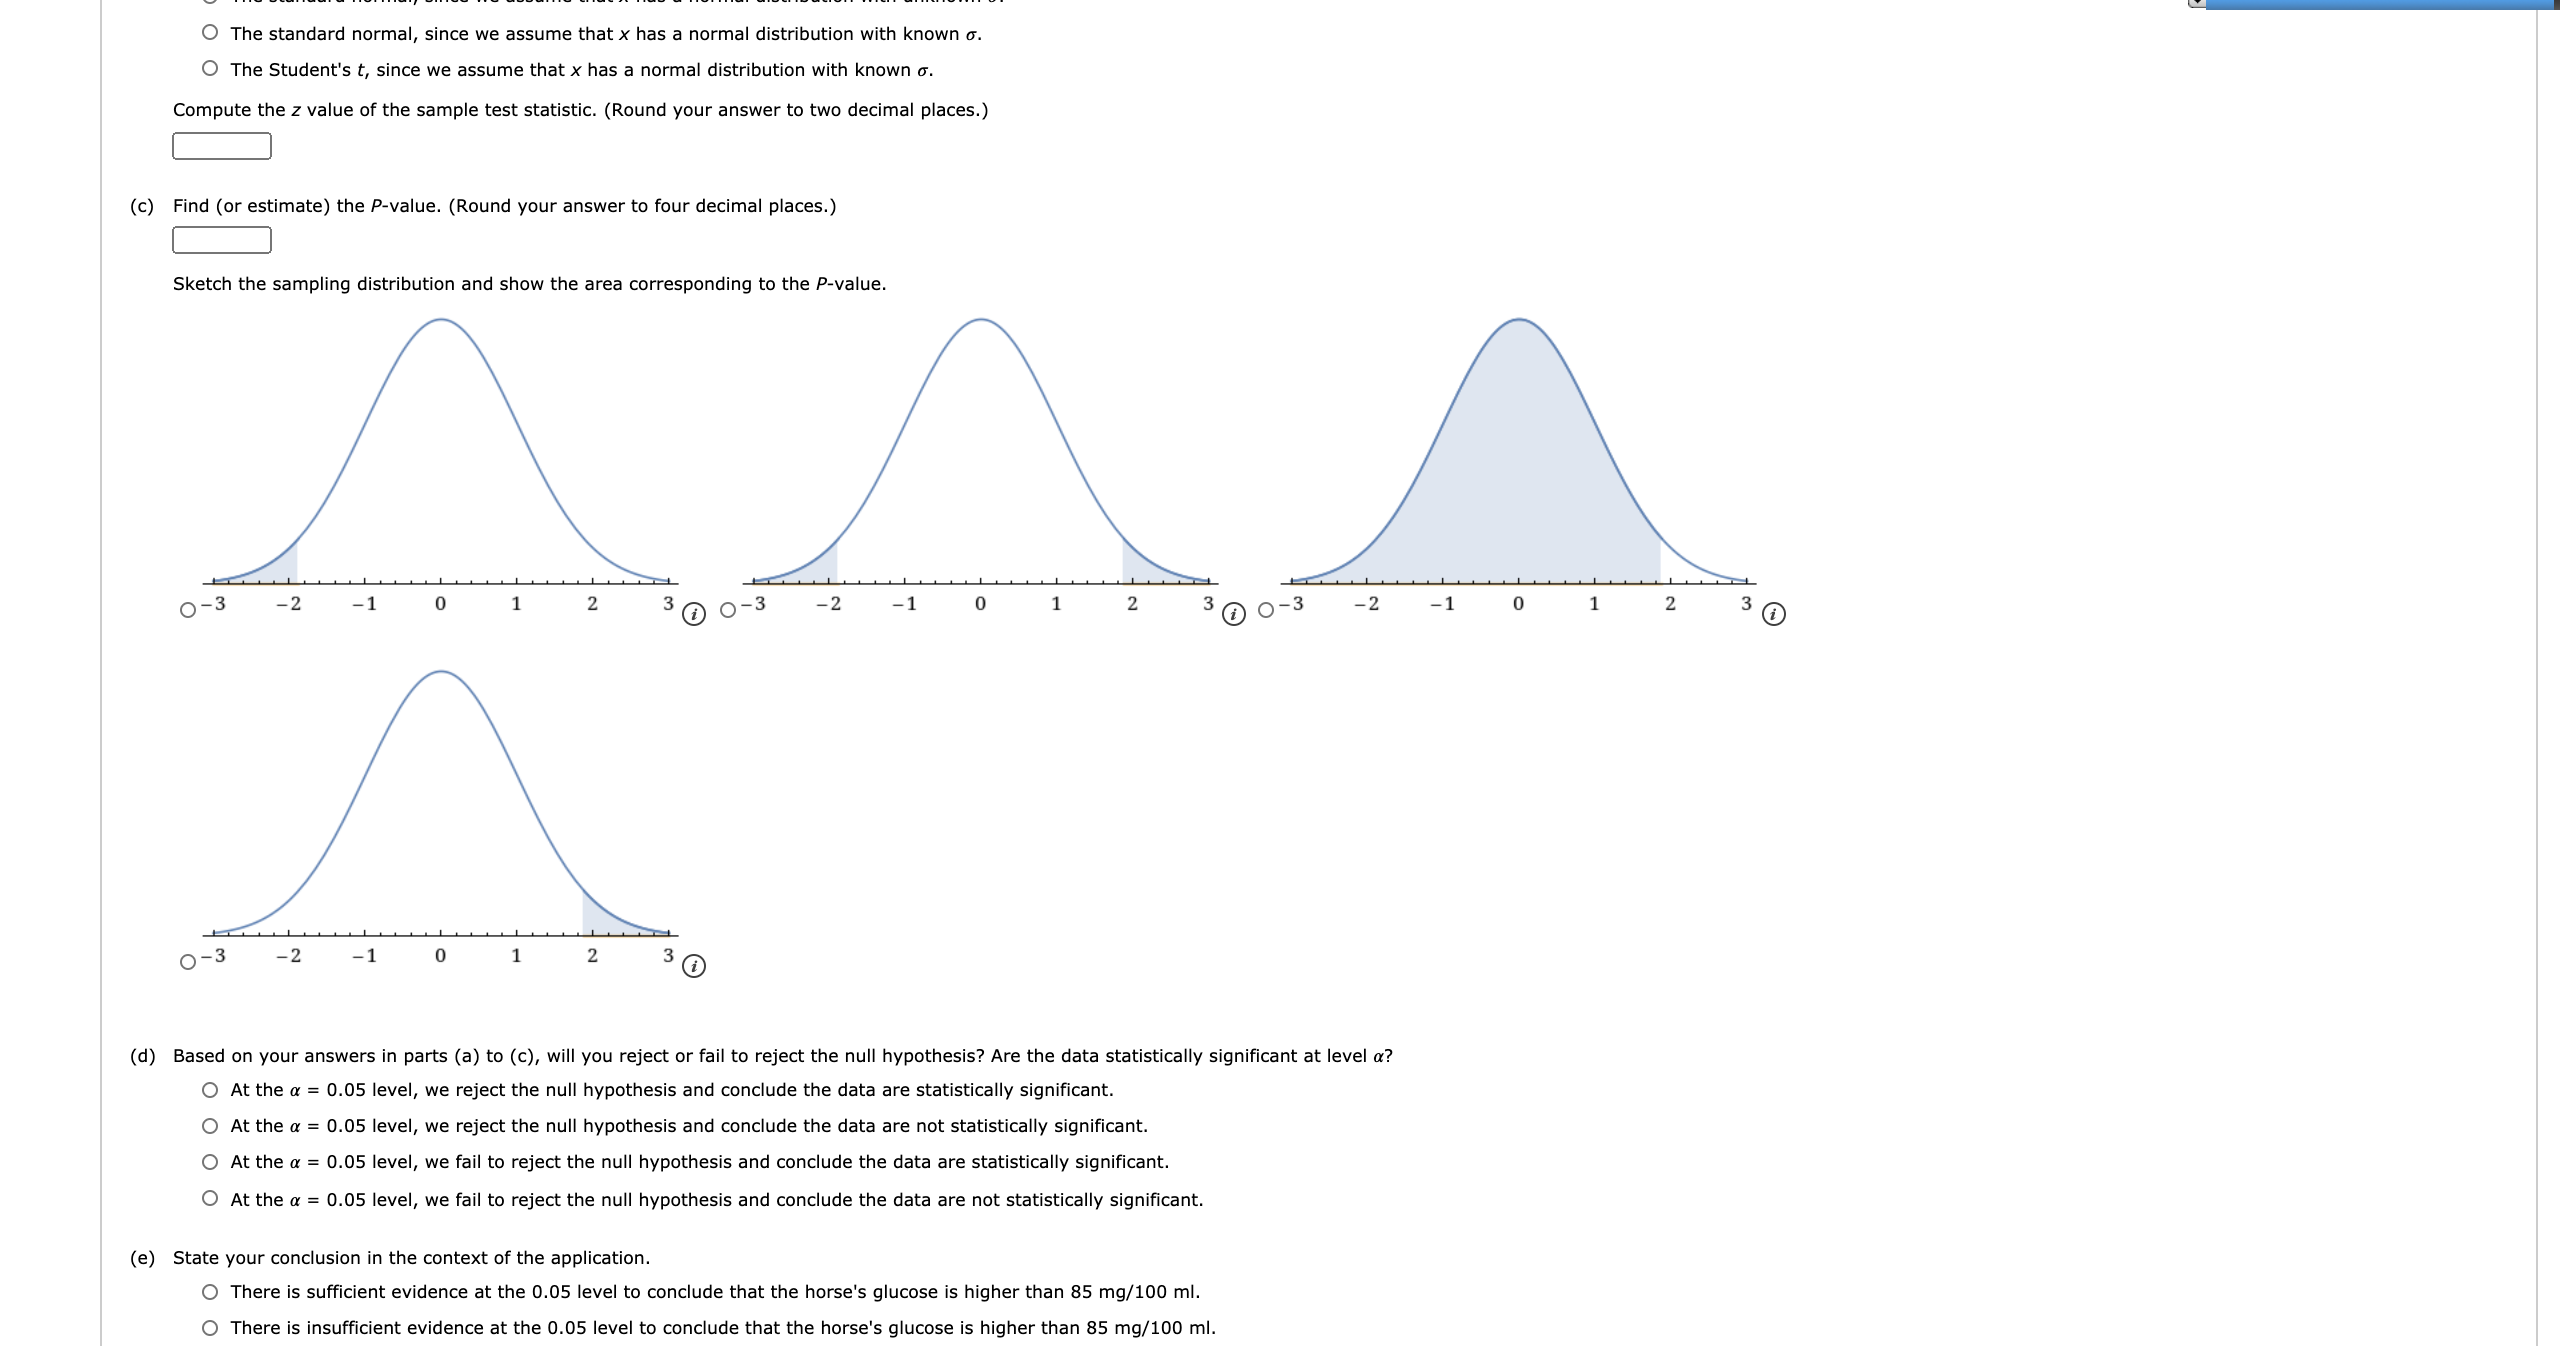
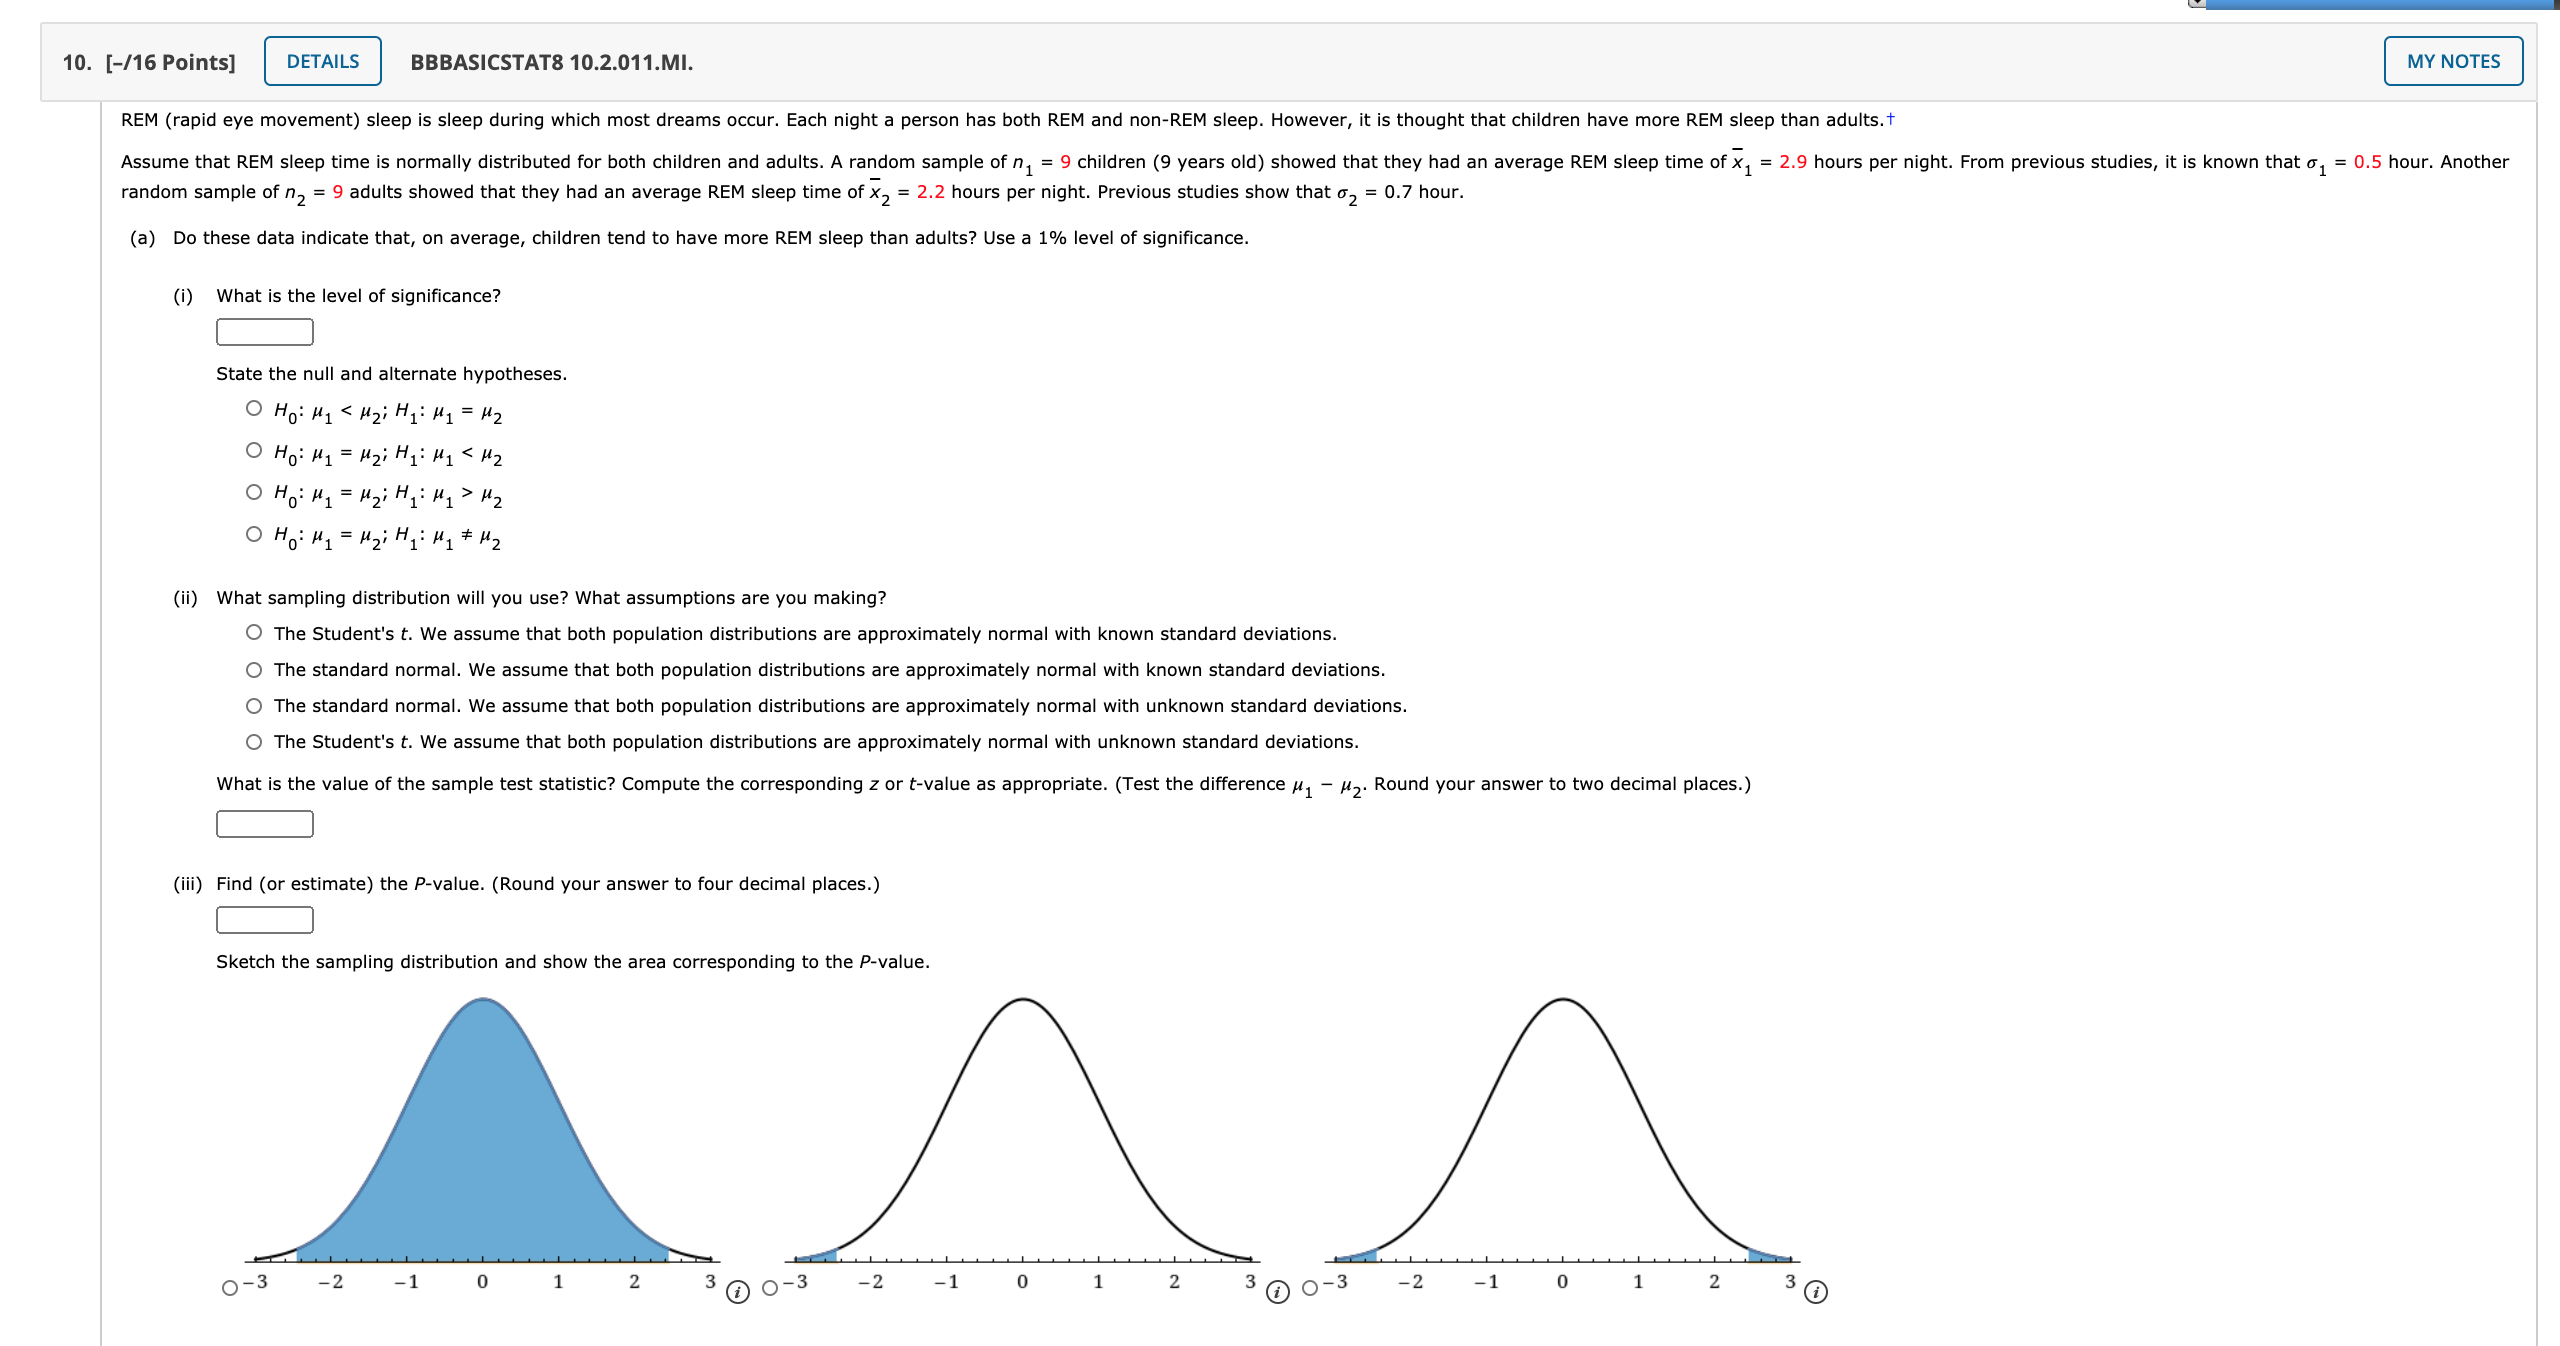
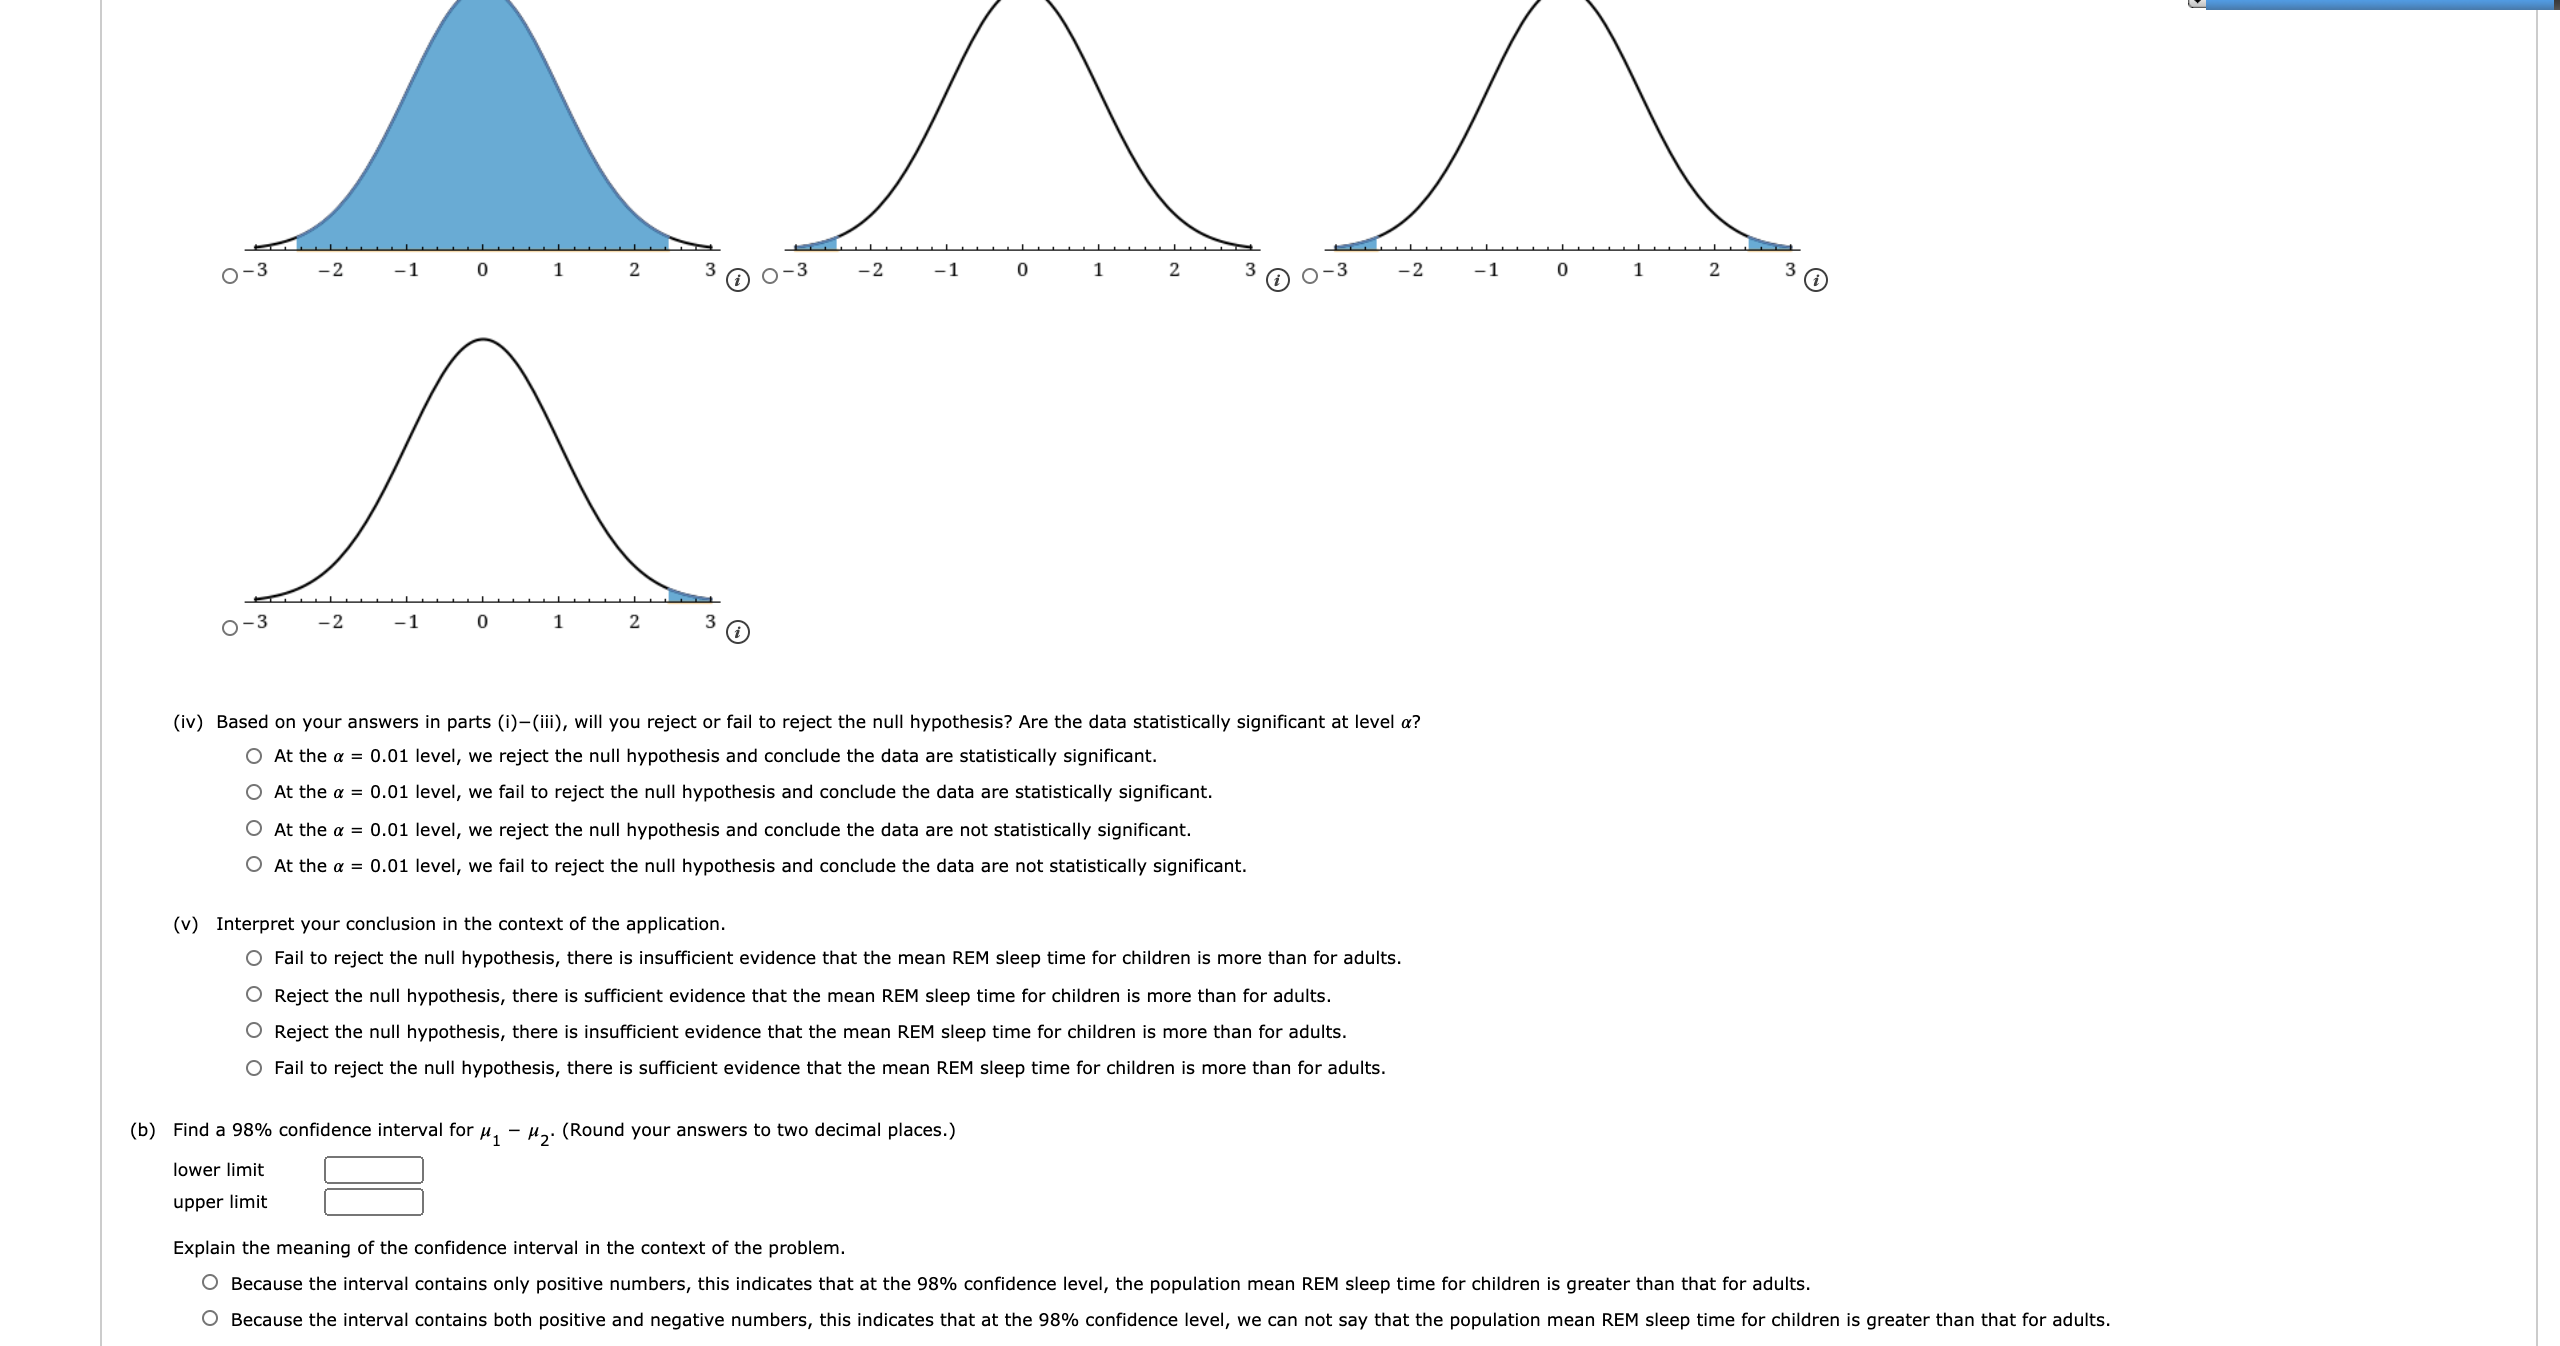
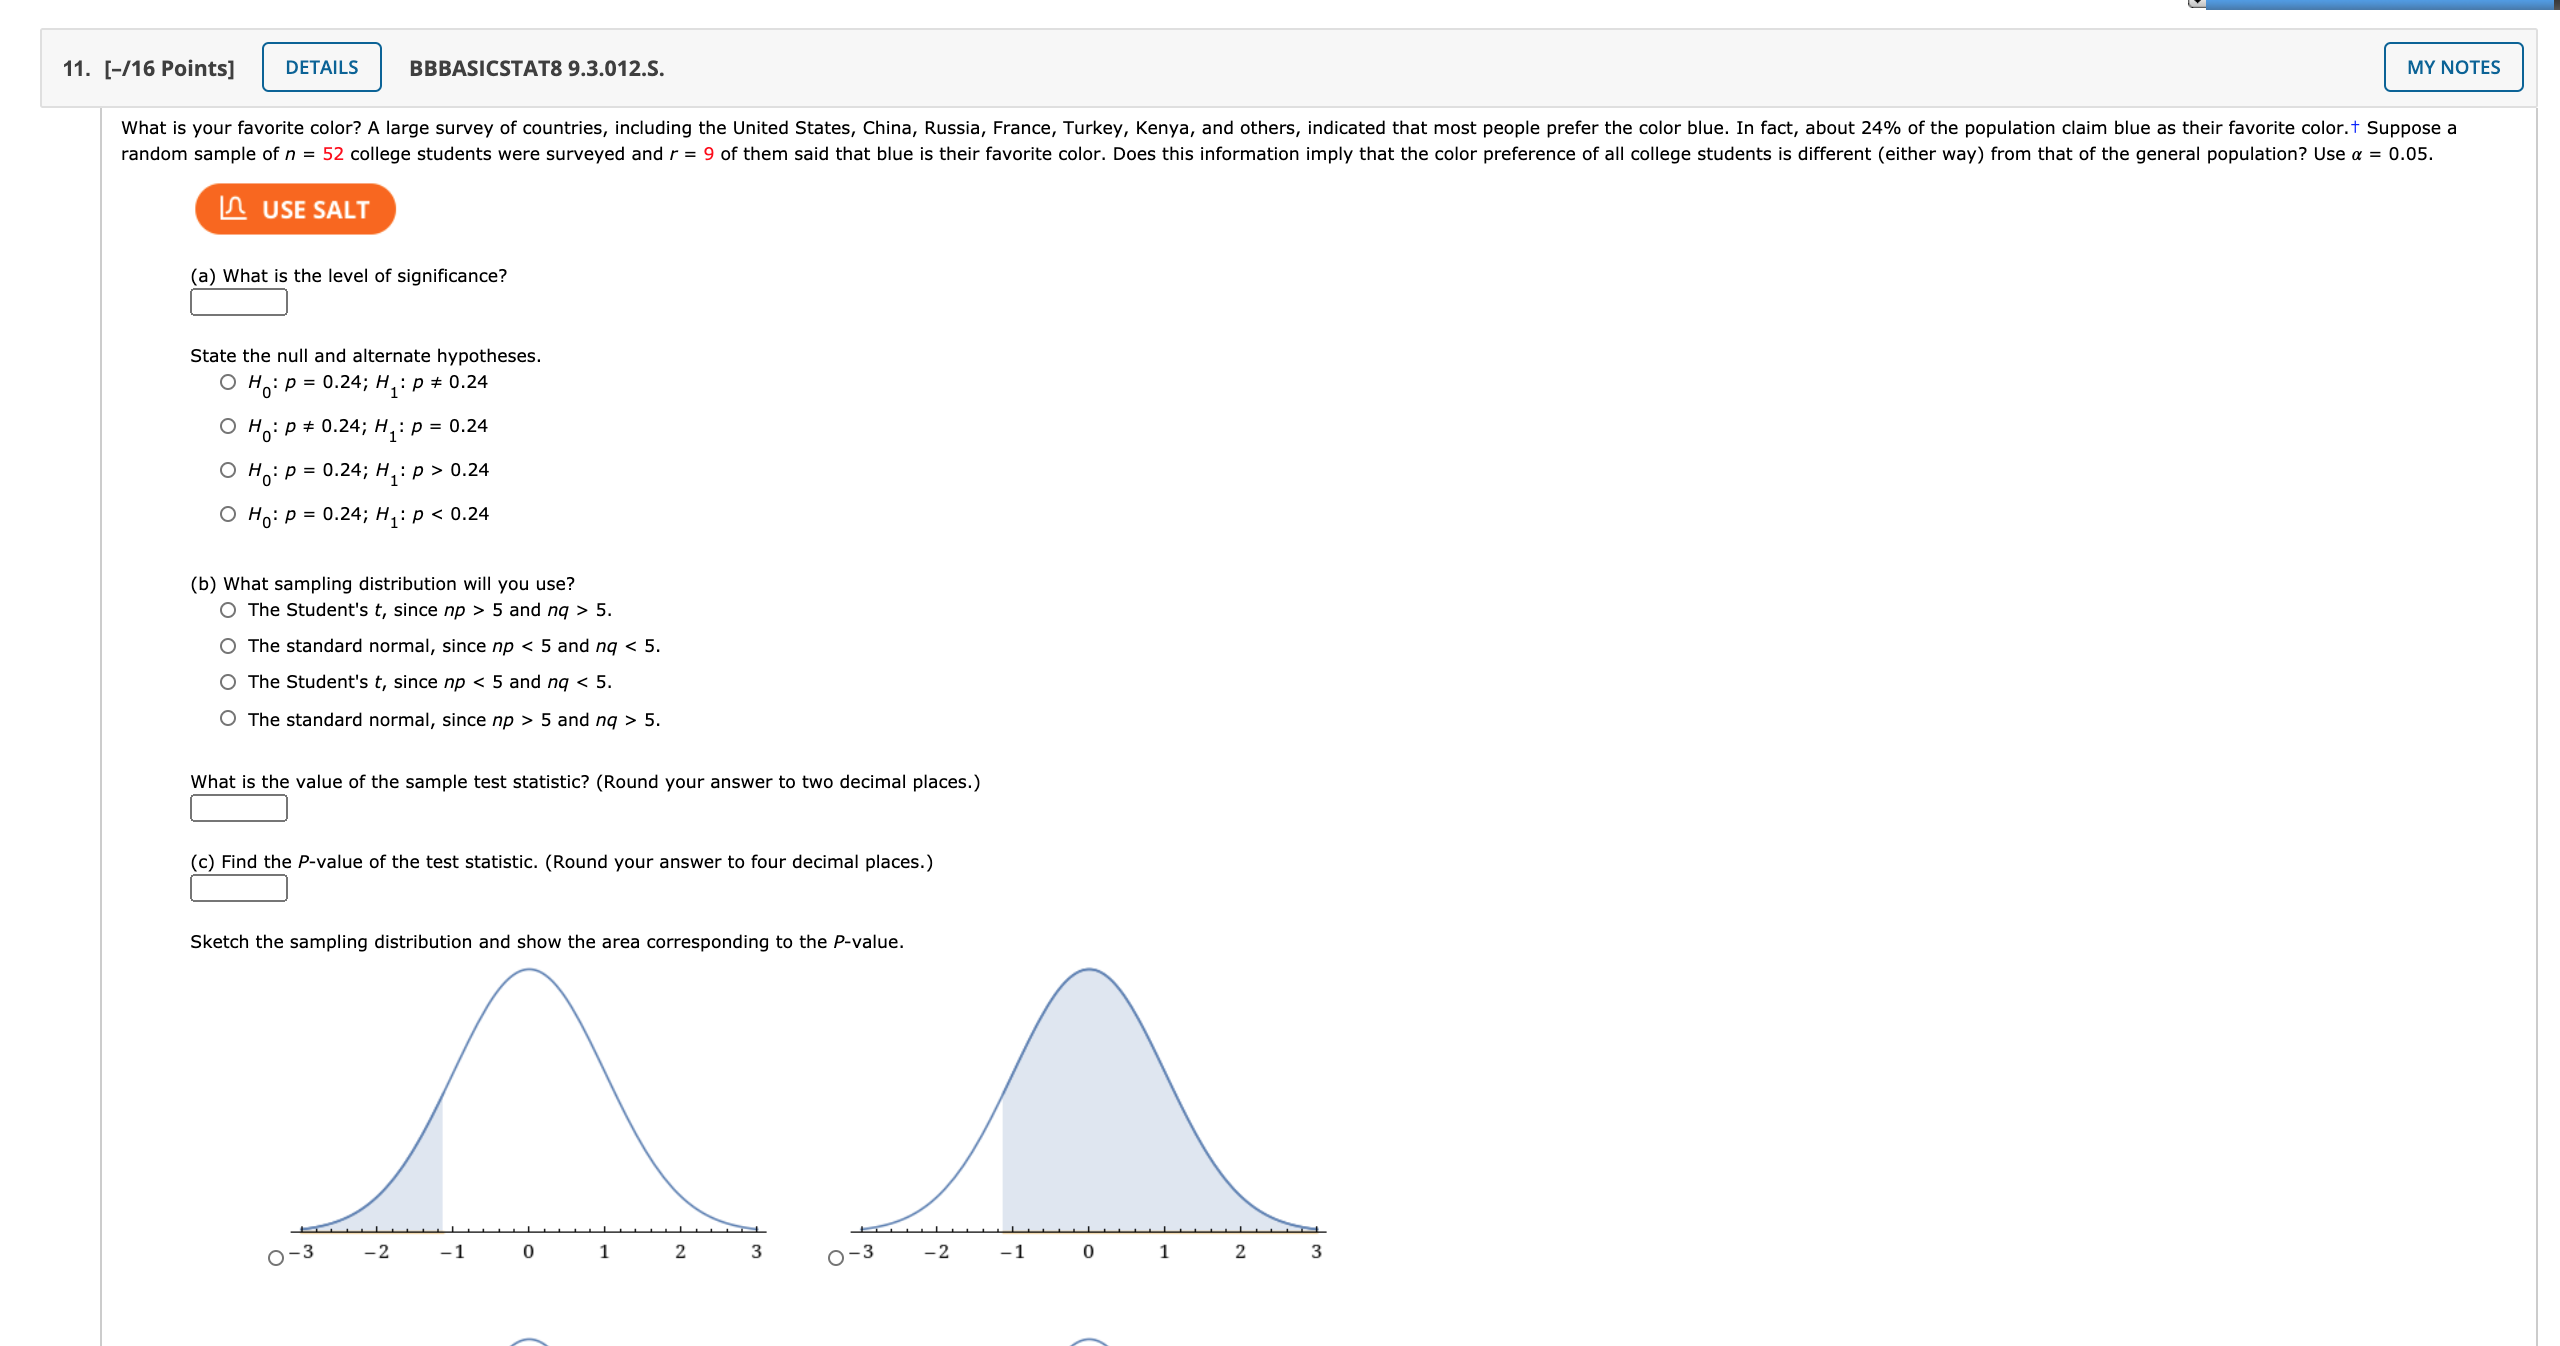
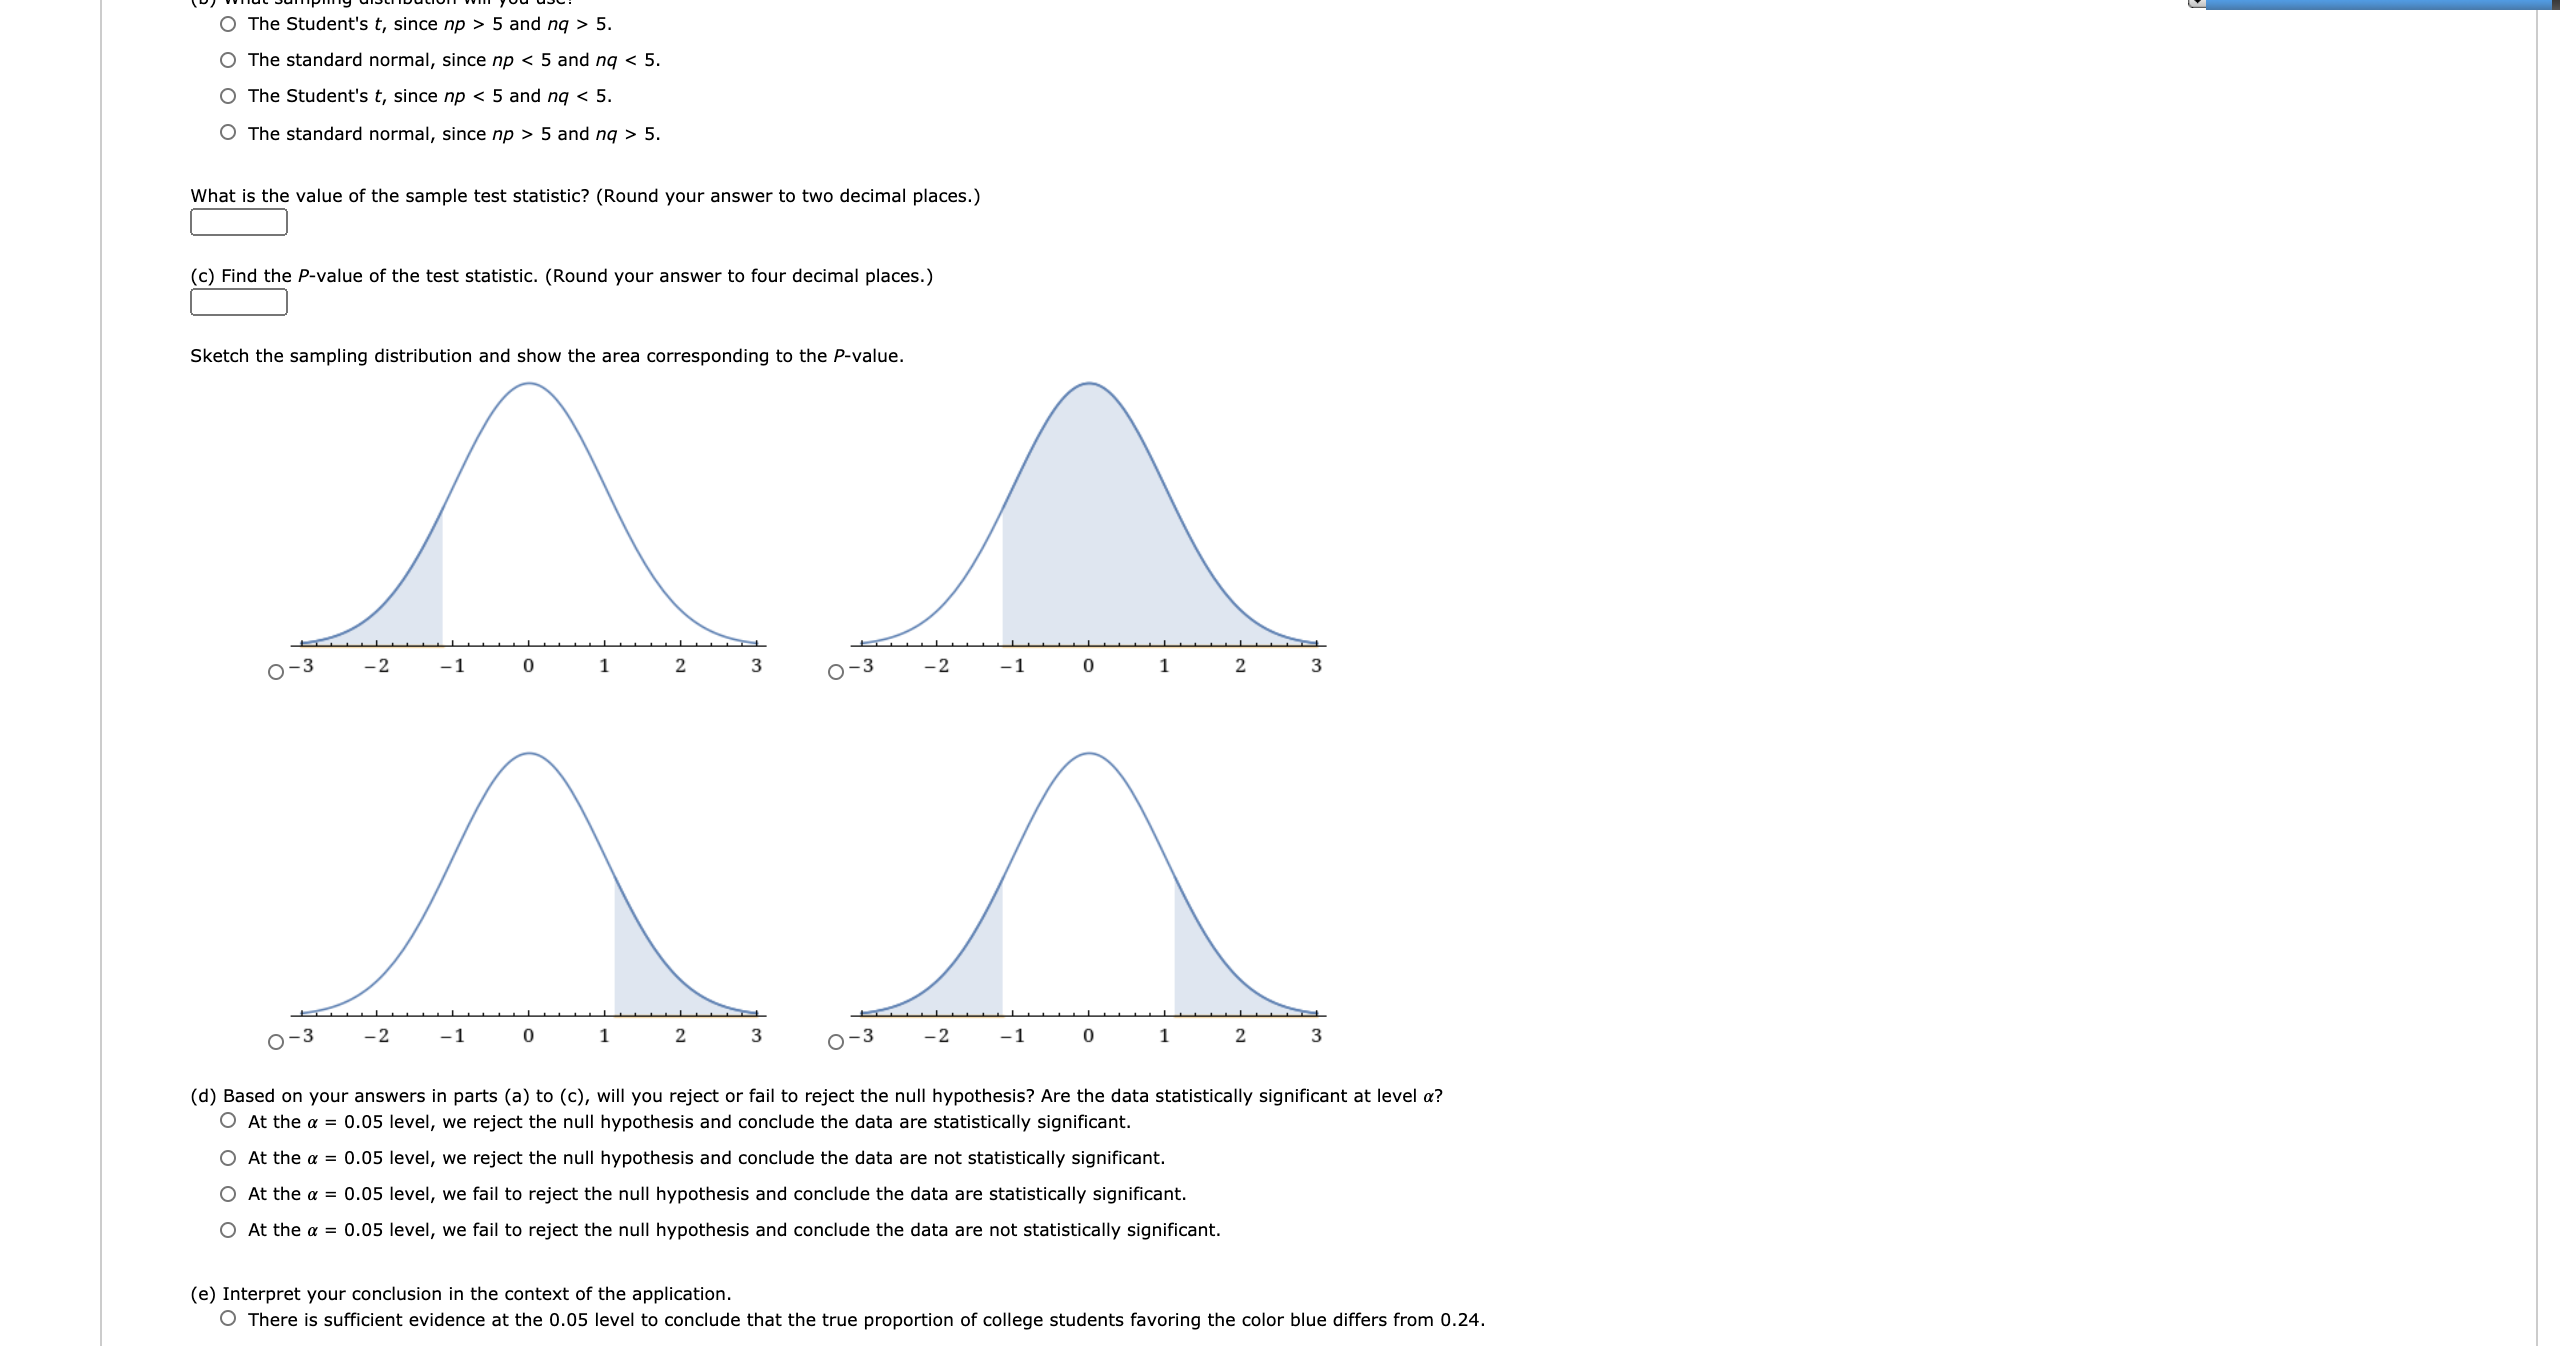
7. [-/16 Points] DETAILS BBBASICSTAT8 9.3.010.MI. MY NOTES Women athletes at a certain university have a long-term graduation rate of 67%. Over the past several years, a random sample of 36 women athletes at the school showed that 23 eventually graduated. Does this indicate that the population proportion of women athletes who graduate from the university is now less than 67%? Use a 1% level of significance. L USE SALT (a) What is the level of significance? (b) State the null and alternate hypotheses. O H : P = 0.67; H : p 0.67 O Ho: P 5 and nq > 5. O The standard normal, since np 5 and nq > 5. What is the value of the sample test statistic? (Round your answer to two decimal places.) (c) Find the P-value of the test statistic. (Round your answer to four decimal places.) Sketch the sampling distribution and show the area corresponding to the P-value. 0-3 -2 -1 0 1 2 31 0-3 -2 -1 2 31 0-3 -2 -1 0 1 2 3 1O The standard normal, since np > 5 and nq > 5. The standard normal, since np 5 and nq > 5. What is the value of the sample test statistic? (Round your answer to two decimal places.) (c) Find the P-value of the test statistic. (Round your answer to four decimal places.) Sketch the sampling distribution and show the area corresponding to the P-value. O-3 -2 -1 1 2 3 1 0-3 -2 -1 2 3 1 0-3 -2 -1 1 2 3 1 0-3 -2 -1 2 (d) Based on your answers in parts (a) to (c), will you reject or fail to reject the null hypothesis? Are the data statistically significant at level a? At the a = 0.01 level, we reject the null hypothesis and conclude the data are statistically significant. O At the a = 0.01 level, we reject the null hypothesis and conclude the data are not statistically significant. O At the a = 0.01 level, we fail to reject the null hypothesis and conclude the data are statistically significant. O At the a = 0.01 level, we fail to reject the null hypothesis and conclude the data are not statistically significant. (e) Interpret your conclusion in the context of the application. There is sufficient evidence at the 0.01 level to conclude that the true proportion of women athletes who graduate is less than 0.67.8. [-/16 Points] DETAILS BBBASICSTAT8 10.3.008.5. MY NOTES Would you favor spending more federal tax money on the arts? Of a random sample of n, = 95 politically conservative voters, , = 20 responded yes. Another random sample of n2 = 75 politically moderate voters showed that 2 = 24 responded yes. Does this information indicate that the population proportion of conservative voters inclined to spend more federal tax money on funding the arts is less than the proportion of moderate voters so inclined? Use a = 0.05. LA USE SALT (a) What is the level of significance? State the null and alternate hypotheses. O Ho: P1 = P2i H1: P1 P2 O Ho: P1 = P2; H1: P1 * P2 O Ho: P1 85; right-tailed O Ho: M > 85; H1: M = 85; right-tailed O Ho: M = 85; H1: M 0.24 O Ho: P = 0.24; H1: p 5 and nq > 5. O The standard normal, since np 5 and nq > 5. What is the value of the sample test statistic? (Round your answer to two decimal places.) (c) Find the P-value of the test statistic. (Round your answer to four decimal places.) Sketch the sampling distribution and show the area corresponding to the P-value. 0-3 -2 -1 0 2 0 -3 -2 -1 0 2.c, ....... .......,...., -..........c.. 0 The Student's 1', since np > 5 and rlq > 5. o The standard normal, since np 5 and H47 > 5. What is the value the sample test statistic? (Round your answer to two decimal places.) (c) Find the Pvalue of the test statistic. (Round your answer to four decimal places.) Sketch the sampling distribution and show the area corresponding to the Pvalue. 03 -2 1 0 1 2 3 0-3 2 1 0 1 2 3 03 2 1 0 1 2 3 03 2 1 O 1 2 3 (d) Based on your answers in parts (a) to (c), will you reject or fail to reject the null hypothesis? Are the data statistically signicant at level a? 0 At the a = 0.05 level, we reject the null hypothesis and conclude the data are statistically signicant. 0 At the or = 0.05 level, we reject the null hypothesis and conclude the data are not statistically signicant. 0 At the a = 0.05 level, we fail to reject me null hypomesis and conclude the data are statistically signicant. 0 At the a = 0.05 level, we fail to reject the null hypothesis and conclude the data are not statistically signicant. (e) Interpret your conclusion in the context of the application. 0 There is sufcient evidence at the 0.05 level to conclude that the hue proportion of college students favoring the color blue differs from 0,24
Step by Step Solution
There are 3 Steps involved in it

Get step-by-step solutions from verified subject matter experts