

Question: Please help with a, b, and fill in chart (c). thank you! 3. This table provides some information about hourly output and revenue for a
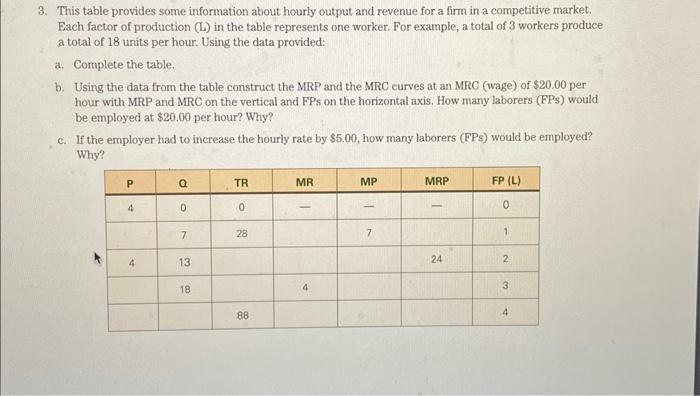
3. This table provides some information about hourly output and revenue for a firm in a competitive market. Each factor of production (L) in the table represents one worker. For example, a total of 3 workers produce a total of 18 units per hour. Using the data provided: a. Complete the table. b. Using the data from the table construct the MRP and the MRC curves at an MRC (wage) of $20.00 per hour with MRP and MRC on the vertical and FPs on the horizontal axis. How many laborers (FPs) would be employed at $20.00 per hour? Why? c. If the employer had to increase the hourly rate by $5.00, how many laborers (FPs) would be employed? Why
Step by Step Solution
There are 3 Steps involved in it

Get step-by-step solutions from verified subject matter experts