

Question: please help with a, b, c, and d i am not getting the right answer. and dont know what im doing wrong A department chair
please help with a, b, c, and d i am not getting the right answer. and dont know what im doing wrong 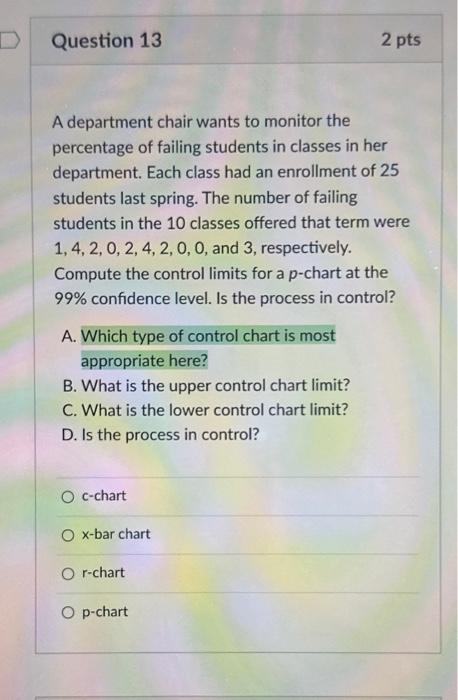
A department chair wants to monitor the percentage of failing students in classes in her department. Each class had an enrollment of 25 students last spring. The number of failing students in the 10 classes offered that term were 1,4,2,0,2,4,2,0,0, and 3 , respectively. Compute the control limits for a p-chart at the 99% confidence level. Is the process in control? A. Which type of control chart is most appropriate here? B. What is the upper control chart limit? C. What is the lower control chart limit? D. Is the process in control? c-chart x-bar chart r-chart p-chart
Step by Step Solution
There are 3 Steps involved in it
1 Expert Approved Answer
Step: 1 Unlock

Question Has Been Solved by an Expert!
Get step-by-step solutions from verified subject matter experts
Step: 2 Unlock
Step: 3 Unlock