

Question: Please help with A-C I Here Is a box plot of some data: I I I I I I I I O 20 4O 60
Please help with A-C
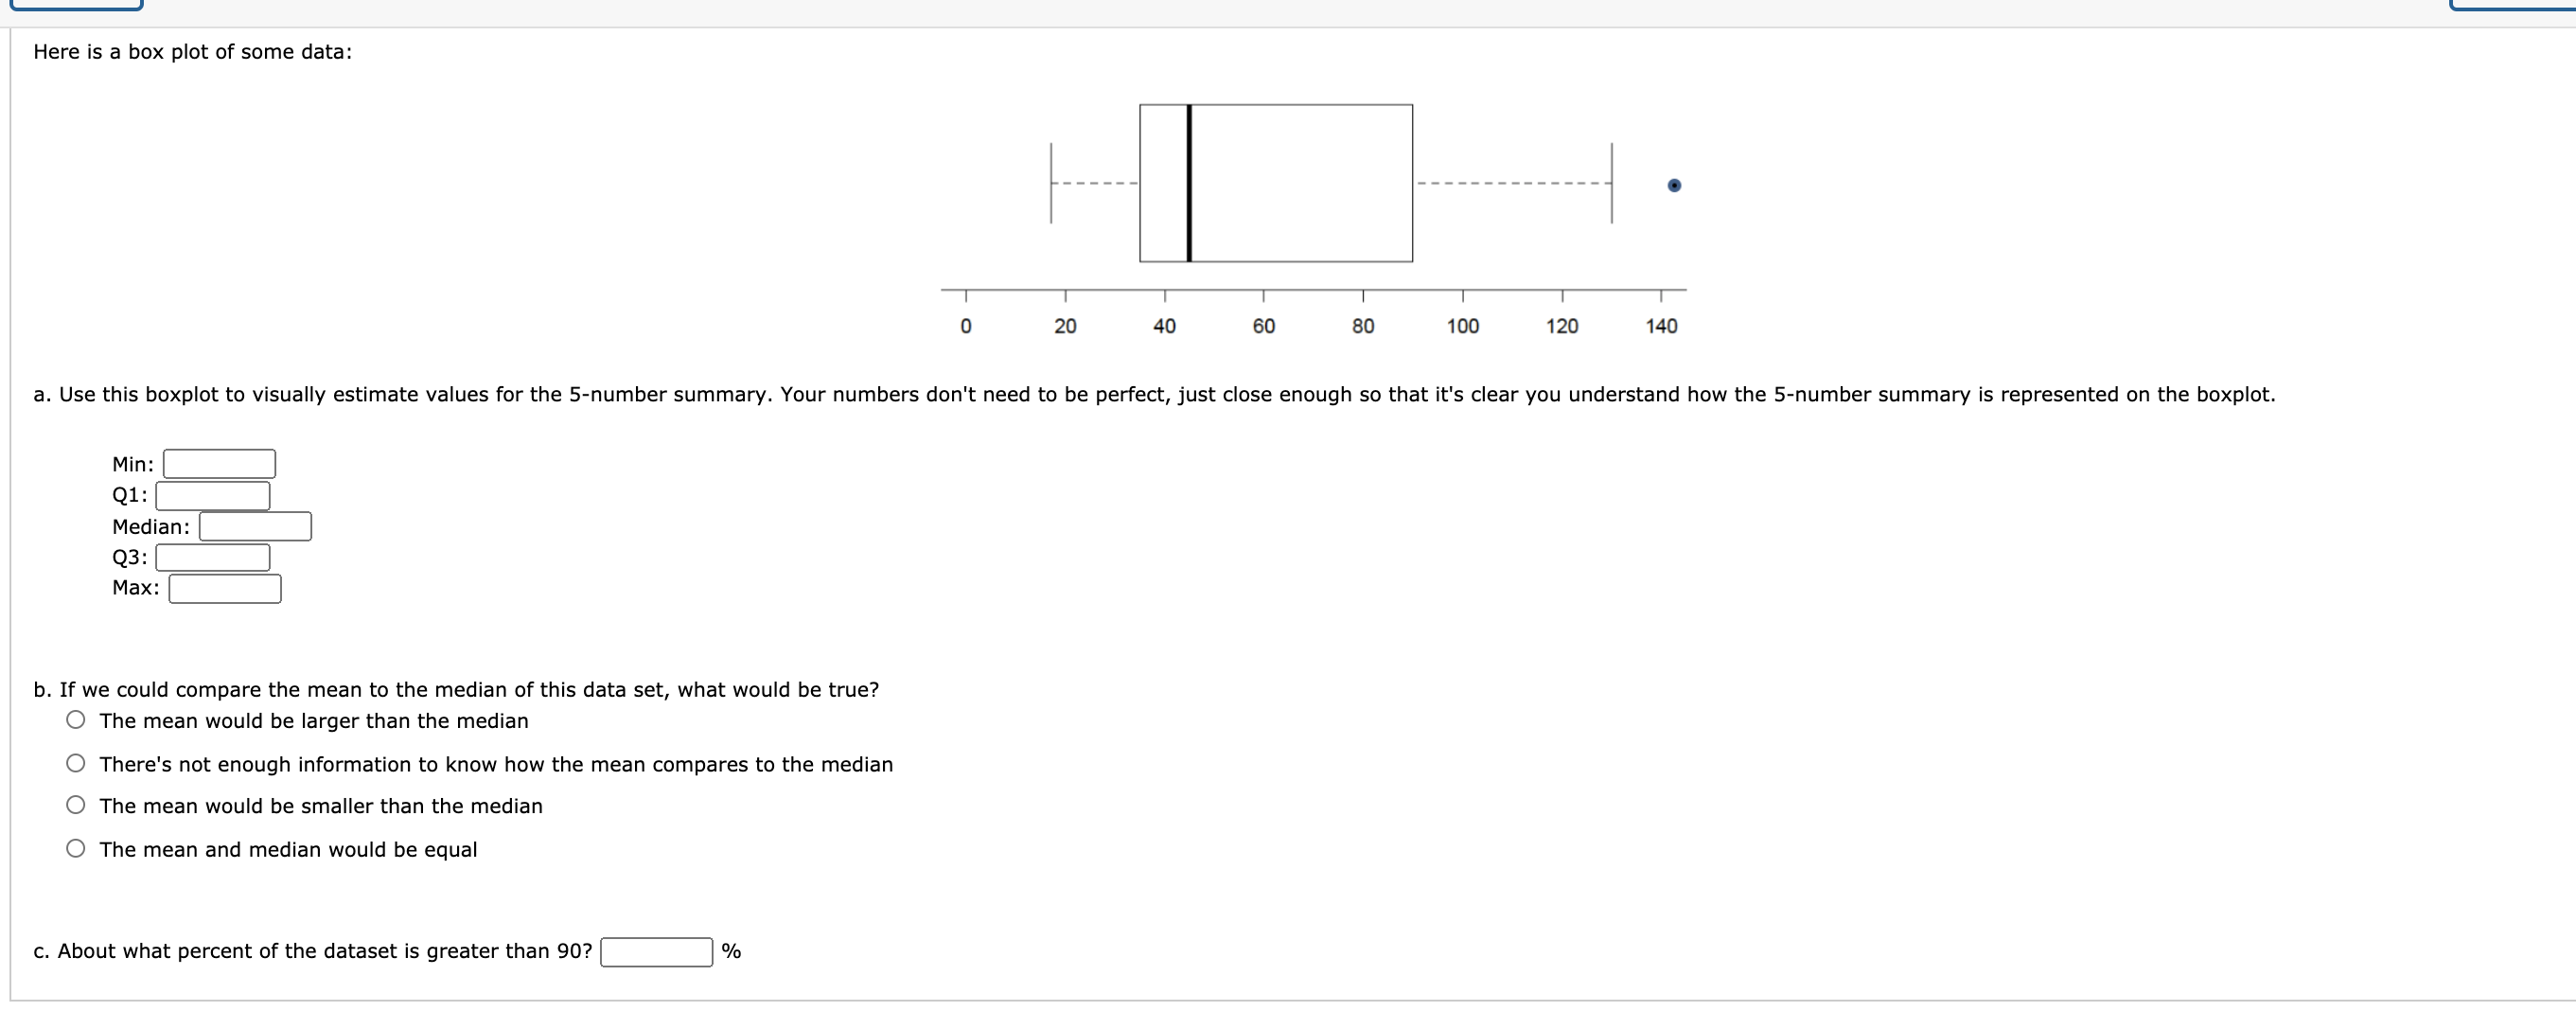
I Here Is a box plot of some data: I I I I I I I I O 20 4O 60 80 100 120 140 ' a. Use this boxplot to visually estimate values for the 5-number summary. Your numbers don't need to be perfect, just close enough so that it's clear you understand how the 5-number summary is represented on the boxplot. Min: Q1: Median: Q3: Max: b. If we could compare the mean to the median of this data set, what would be true? 0 The mean would be larger than the median 0 There's not enough information to know how the mean compares to the median O The mean would be smaller than the median ' O The mean and median would be equal c. About what percent of the dataset is greater than 90? %
Step by Step Solution
There are 3 Steps involved in it

Get step-by-step solutions from verified subject matter experts