

Question: please help with all 2) (10 points) Seasonality: The data in the table below (and available online) represent monthly gross sales for Ska Brewing Company
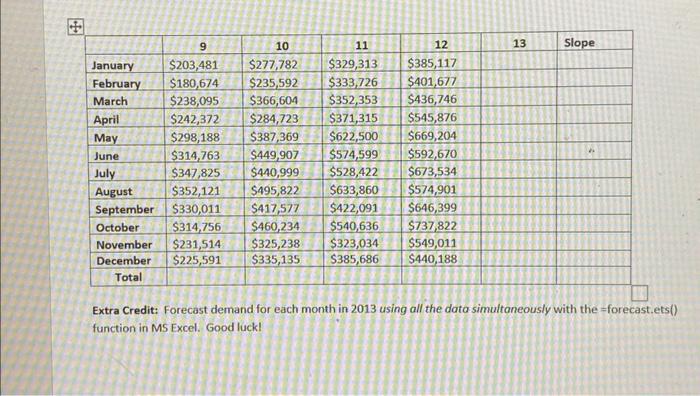
2) (10 points) Seasonality: The data in the table below (and available online) represent monthly gross sales for Ska Brewing Company from 2009 to 2012. This is real (old) data, let's help Ska forecast 2013.. a) Sum up the totals for each year and fill in the blanks below. b) Forecast demand for each month and the total for 2013 using linear regression. What is your best estimate for total sales in 2013? Note: This table is transposed compared to the seasonality example we looked at in class - in this case, you will be forecasting horizontally. c) Graph the monthly data and forecasts (preferably in a different color) in chronological order to display the seasonal pattern. Insert the graph here. d) Determine the slope for each month and fill in the blanks below. According to the slopes, which two months are growing the fastest (at about the same rate)? e) Interpret the slope for the two fastest growing month(s) and interpret the annual slope. Extra Credit: Forecast demand for each month in 2013 using all the data simultaneously with the =forecast.ets() function in MS Excel. Good luck
Step by Step Solution
There are 3 Steps involved in it

Get step-by-step solutions from verified subject matter experts