Question: Please help with all 3 questions in this Case Study. Especially #3. The sixth case study is Case 4.2 and is Bigelow Stores (p. 131).
Please help with all 3 questions in this Case Study. Especially #3.
The sixth case study is Case 4.2 and is Bigelow Stores (p. 131). This case study describes a general merchandise retailer that is looking to expand through acquisitions. The new Bigelow represents operations that are different in product lines, geographies, and customer touchpoints. You are to assist management on how to proceed with their new operations footprint to serve their new markets. You are to read this case study and answer all three questions. It is expected that you use the strategies located within your textbook when answering these questions. It is also expected that you properly conduct research to add an additional dimension on top of your textbook readings to properly answer each of these questions.
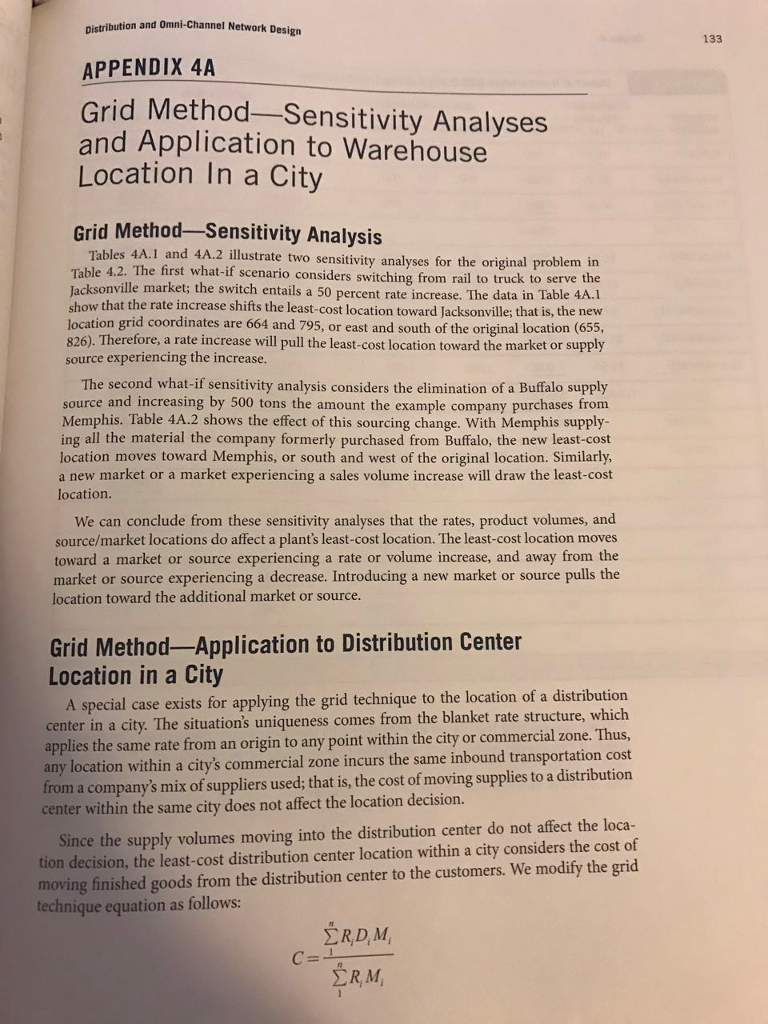
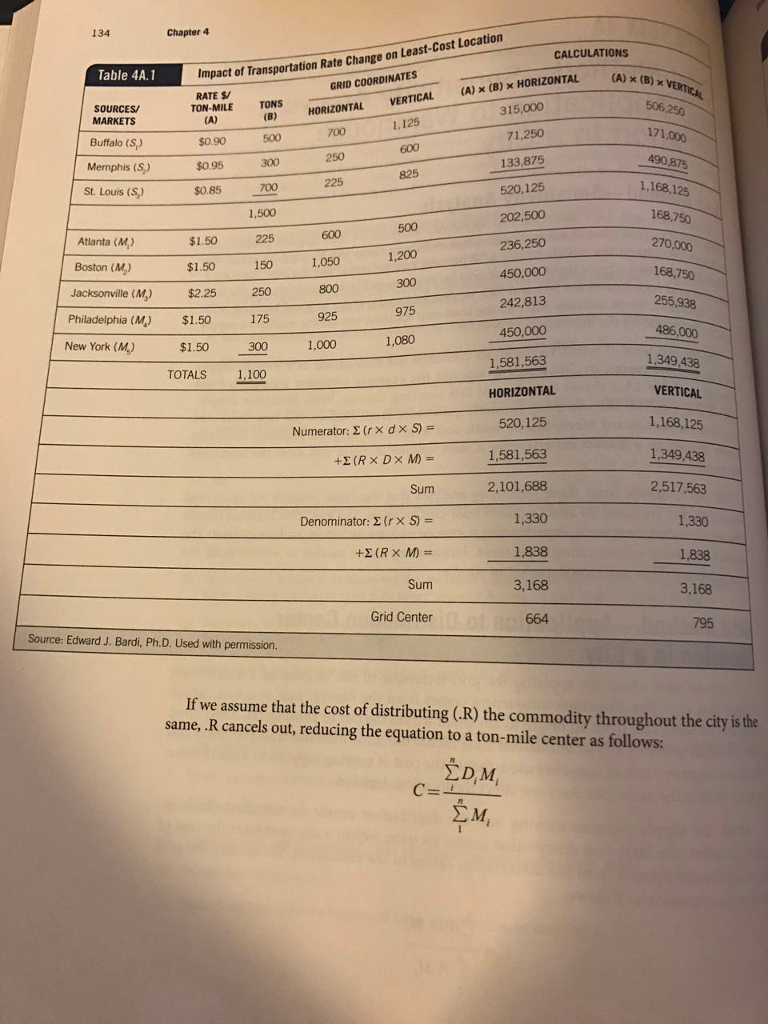
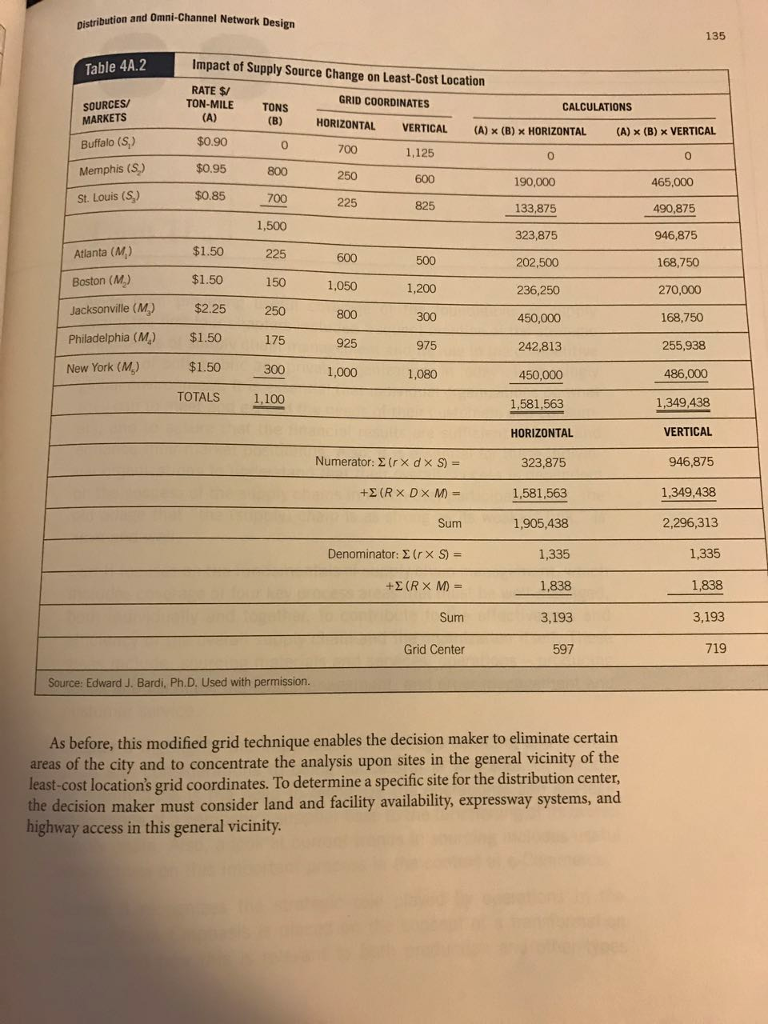
Distribution and Omni-Channel Network Design 131 CASE 4.2 Bigelow Stores Bigelow stores is a general merchandise retailer located in Atlanta, GA. With 250 stores and three distribution centers (DCs) located in the southeast United States, Bigelow has captured a significant market share in the off-price market. Bigelow carries everyday items as well as "one-time" buy specials that it advertises to consumers at special discounted prices. Bigelow also carries food products with expiration dates but none need refrigeration. Because of the density of the market and the size of its stores, Bigelow can ship full truckloads (TL) of its products from its DCs to its stores on a daily basis. Bigelow currently does not have an internet presence. With a high market penetration in the southeast intact, Bigelow has decided to expand into the northeast and midwest through acquisitions. It has acquired a medium-sized retailer in Pennsylvania, Lions, that specializes in both general merchandise and perishable and non-perishable food items. Lions currently has 100 stores and two distribution centers in the northeast. It utilizes both direct TL shipments to larger stores that are closer to the DCs and pool distribution to the smaller, more distant stores. Lions has an internet pres- ence where consumers can order groceries online and then pick their order up the same day at the store. Bigelow also acquired Spartan Stores, located in Michigan. Spartan is an outdoor recreational sports retailer that has 50 stores and one DC. It is an omni-channel retailer that picks and ships both store and internet orders from its single DC. Spartan utilizes LTL carriers for store deliveries and small package carriers internet orders. Bigelow's strategy is to grow these acquired firms, first regionally, then nationally and to incorporate them under the Bigelow name. It also has decided to invest heavily in an inter- net presence to become an omni-channel retailer. CASE QUESTIONS 1. The new Bigelow "network" is comprised of different product lines, with different geographies and volumes, with varying customer touch points (stores versus internet). How would you advise the management of Bigelow on how to proceed in implementing their one-brand, omni-channel strategy? 2. What type(s) of customer fulfillment networks would you implement to service the different channels in different geographies? 3. What challenges and opportunities do you see for Bigelow in offering all products to all consumers on a single Web site? Would the current DC network support this strategy? Explain your answer. Distribution and Omni-Channel Network Design 133 APPENDIX 4A Grid Method-Sensitivity Analyses and Application to Warehouse Location In a City Grid MethodSensitivity Analysis Tables 4A.1 and 4A.2 illustrate two sensitivity analyses for the original problem in Table 4.2. The first what-if scenario considers switching from rail to truck to serve the Jacksonville market; the switch entails a 50 percent rate increase. The data in Table 4A.1 show that the rate increase shifts the least-cost location toward Jacksonville; that is, the new location grid coordinates are 664 and 795, or east and south of the original location (655, 826). Therefore, a rate increase will pull the least-cost location toward the market or supply source experiencing the increase. The second what-if sensitivity analysis considers the elimination of a Buffalo supply source and increasing by 500 tons the amount the example company purchases from Memphis. Table 4A.2 shows the effect of this sourcing change. With Memphis supply- ing all the material the company formerly purchased from Buffalo, the new least-cost location moves toward Memphis, or south and west of the original location. Similarly, a new market or a market experiencing a sales volume increase will draw the least-cost location. We can conclude from these sensitivity analyses that the rates, product volumes, and source/market locations do affect a plant's least-cost location. The least-cost location moves toward a market or source experiencing a rate or volume increase, and away from the market or source experiencing a decrease. Introducing a new market or source pulls the location toward the additional market or source. Grid MethodApplication to Distribution Center Location in a City A special case exists for applying the grid technique to the location of a distribution center in a city. The situation's uniqueness comes from the blanket rate structure, which applies the same rate from an origin to any point within the city or commercial zone. Thus, any location within a city's commercial zone incurs the same inbound transportation cost from a company's mix of suppliers used; that is, the cost of moving supplies to a distribution center within the same city does not affect the location decision. Since the supply volumes moving into the distribution center do not affect the loca- tion decision, the least-cost distribution center location within a city considers the cost of moving finished goods from the distribution center to the customers. We modify the grid technique equation as follows: RDM R, M, 134 Chapter 4 CALCULATIONS Table 4A.1 Impact of Transportation Rate Change on Least-Cost Location GRID COORDINATES (A) x (B) x HORIZONTAL (A) (B) VERTICA 506 250 VERTICAL TONS (B) HORIZONTAL 315.000 RATE S TON-MILE (A) $0.90 SOURCES/ MARKETS Buffalo (S) 1.125 700 500 171.000 71,250 600 250 300 $0.95 490,875 Memphis (5) 133,875 825 225 St. Louis (S) $0.85 700 520,125 1,168,125 1.500 202,500 168,750 500 600 Atlanta (M) $1.50 225 236,250 270.000 1,200 $1.50 1,050 Boston (M) 150 450,000 168,750 300 Jacksonville (M) $2.25 800 250 242,813 255,938 975 $1.50 175 925 Philadelphia (M) New York (M) 450.000 486,000 $1.50 300 1,000 1,080 1,581,563 1,349,438 TOTALS 1,100 HORIZONTAL VERTICAL 520,125 1,168,125 Numerator: (rx d x S) = +E (RX DX M) = 1,581,563 1,349,438 Sum 2,101,688 2,517,563 Denominator: (rx S) = 1,330 1,330 +(RX M) = 1,838 1.838 Sum 3,168 3.168 Grid Center 664 795 Source: Edward J. Bardi, Ph.D. Used with permission. If we assume that the cost of distributing (.R) the commodity throughout the city is the same, .R cancels out, reducing the equation to a ton-mile center as follows: DM C=' , Distribution and Omni-Channel Network Design 135 Table 4A.2 Impact of Supply Source Change on Least-Cost Location RATE $/ TON-MILE (A) GRID COORDINATES SOURCES/ MARKETS CALCULATIONS TONS (B) HORIZONTAL VERTICAL (A) x (B) x HORIZONTAL (A) x (B) X VERTICAL Buffalo (S) $0.90 0 700 1,125 0 0 Memphis (5) $0.95 800 250 600 190,000 465,000 St. Louis (S) $0.85 700 225 825 133,875 490,875 1,500 323,875 946,875 Atlanta (M.) $1.50 225 600 500 202,500 168,750 Boston (M.) $1.50 150 1,050 1,200 236,250 270,000 Jacksonville (M) $2.25 250 800 300 450,000 168,750 Philadelphia (M) $1.50 175 925 975 242,813 255,938 New York (M) $1.50 300 1.000 1,080 450,000 486,000 TOTALS 1,100 1.581.563 1,349,438 HORIZONTAL VERTICAL Numerator: (rx d x S) = 323,875 946,875 +(RX DX M) = 1,581,563 1,349,438 Sum 1.905,438 2,296,313 Denominator: (rx S) = 1,335 1,335 +(RX M) 1,838 1,838 Sum 3,193 3,193 Grid Center 597 719 Source: Edward J. Bardi, Ph.D. Used with permission. As before, this modified grid technique enables the decision maker to eliminate certain areas of the city and to concentrate the analysis upon sites in the general vicinity of the least-cost location's grid coordinates. To determine a specific site for the distribution center, the decision maker must consider land and facility availability, expressway systems, and highway access in this general vicinity


