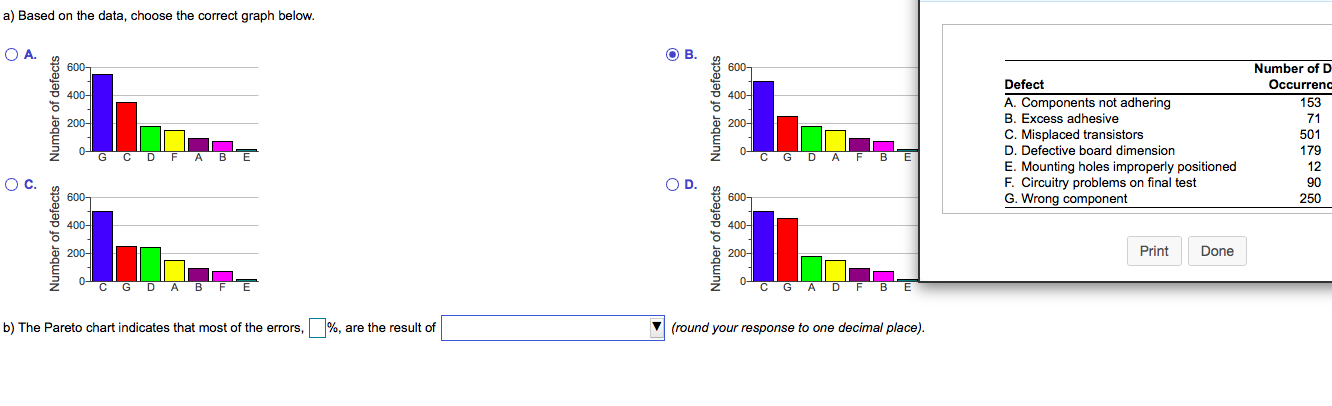
Question: Please help with b) a) Based on the data, choose the correct graph below. OA. B. 600 600- 400 400- Number of defects Number of

Please help with b) a) Based on the data, choosePlease help with b)

a) Based on the data, choose the correct graph below. OA. B. 600 600- 400 400- Number of defects Number of defects 200- 200- Defect A. Components not adhering B. Excess adhesive C. Misplaced transistors D. Defective board dimension E. Mounting holes improperly positioned F. Circuitry problems on final test G. Wrong component Number of D Occurrenc 153 71 501 179 12 90 250 0- 0 G C D F B E C G D AFB E OC. OD. 600 6001 400- 400- Number of defects Number of defects 200- 200- Print Done 0 0 G DAB F E C G A D F B E b) The Pareto chart indicates that most of the errors, %, are the result of (round your response to one decimal place)

Step by Step Solution

There are 3 Steps involved in it

1 Expert Approved Answer
Step: 1 Unlock blur-text-image
Question Has Been Solved by an Expert!

Get step-by-step solutions from verified subject matter experts

Step: 2 Unlock
Step: 3 Unlock

Students Have Also Explored These Related General Management Questions!