

Question: PLEASE HELP WITH CODING ASSIGNMENT i have four data files that are .dat Note: As a solution to each of the exercises, upload your python
i have four data files that are .dat
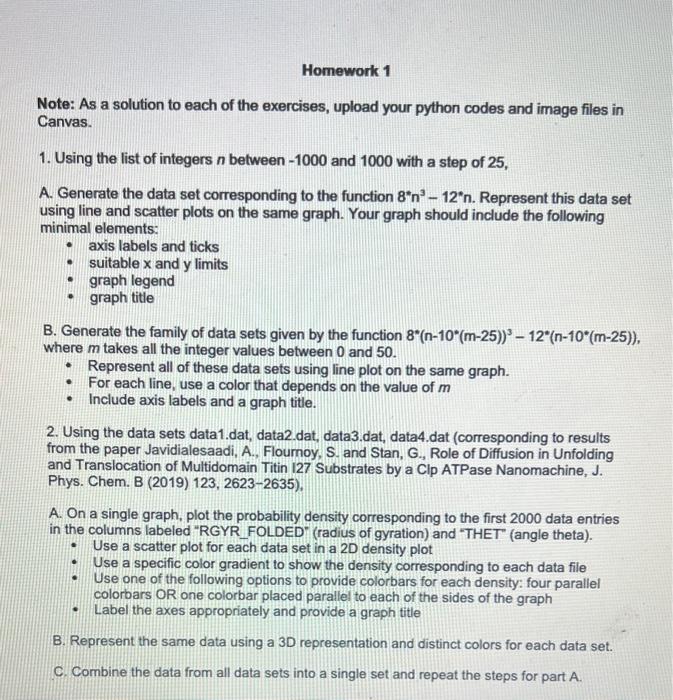
Note: As a solution to each of the exercises, upload your python codes and image files in Canvas. 1. Using the list of integers n between 1000 and 1000 with a step of 25 , A. Generate the data set corresponding to the function 8n312n. Represent this data set using line and scatter plots on the same graph. Your graph should include the following minimal elements: - axis labels and ticks - suitable x and y limits - graph legend - graph title B. Generate the family of data sets given by the function 8(n10(m25))312(n10(m25)), where m takes all the integer values between 0 and 50 . - Represent all of these data sets using line plot on the same graph. - For each line, use a color that depends on the value of m - Include axis labels and a graph title. 2. Using the data sets data1.dat, data2.dat, data3.dat, data4.dat (corresponding to results from the paper Javidialesaadi, A., Floumoy, S. and Stan, G., Role of Diffusion in Unfolding and Translocation of Multidomain Titin I27 Substrates by a Clp ATPase Nanomachine, J. Phys. Chem. B (2019) 123, 2623-2635). A. On a single graph, plot the probability density corresponding to the first 2000 data entries in the columns labeled "RGYR_FOLDED' (radius of gyration) and "THET" (angle theta). - Use a scatter plot for each data set in a 2D density plot. - Use a specific color gradient to show the density corresponding to each data file - Use one of the following options to provide colorbars for each density: four parallel colorbars OR one colorbar placed parallel to each of the sides of the graph - Label the axes appropriately and provide a graph title
Step by Step Solution
There are 3 Steps involved in it

Get step-by-step solutions from verified subject matter experts