

Question: please help with correct calculations for the questions above!! Points Available 2 3 3 Points You have been asked to analyze the trend in Tesla
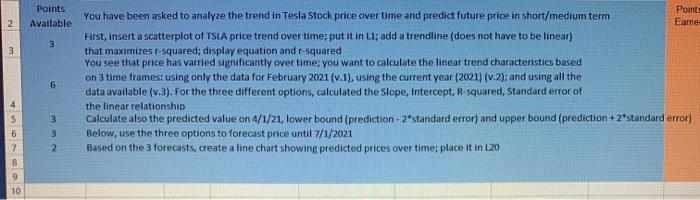
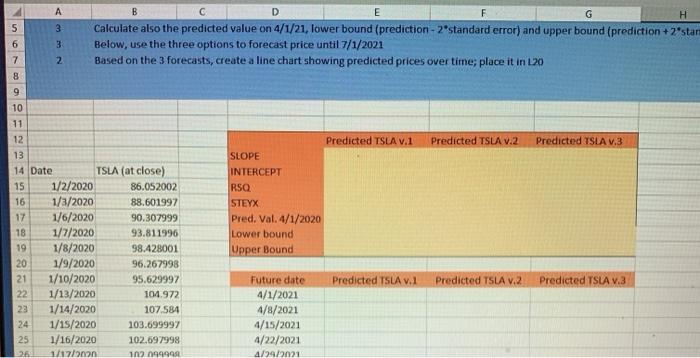
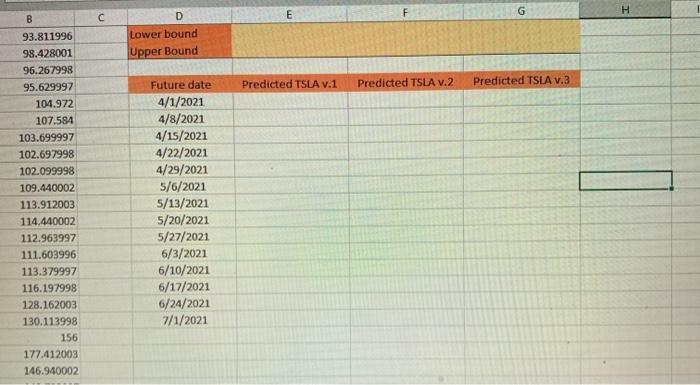
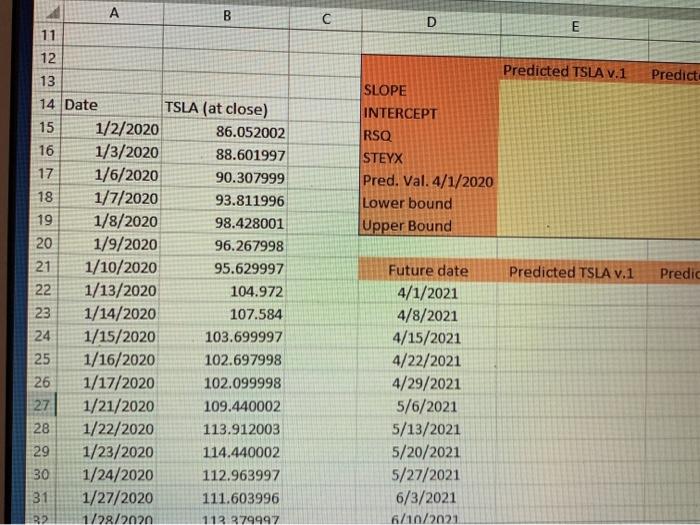
Points Available 2 3 3 Points You have been asked to analyze the trend in Tesla Stock price over time and predict future price in short/medium term Earnes First, insert a scatterplot of TSIA price trend over time; put it in li; add a trendline (does not have to be linear) that maximizes t-squared; display equation and r-squared You see that price has varried significantly over time you want to calculate the linear trend characteristics based on 3 time frames: using only the data for February 2021 (v.1), using the current year (2021) (v.2); and using all the data available (v.3). For the three different options, calculated the Slope, Intercept, R-squared, Standard error of the linear relationship Calculate also the predicted value on 4/1/21, lower bound (prediction - 2"standard error) and upper bound (prediction +2*standard error) Below, use the three options to forecast price until 7/1/2021 Based on the 3 forecasts, create a line chart showing predicted prices over time; place it in L20 6 S 3 3 2 7 8 10 B F G 5 6 7 8 3 3 2 D E H Calculate also the predicted value on 4/1/21, lower bound (prediction - 2*standard error) and upper bound (prediction +7'star Below, use the three options to forecast price until 7/1/2021 Based on the 3 forecasts, create a line chart showing predicted prices over time, place it in 120 9 10 11 Predicted TSLA V.1 Predicted TSLA V.2 Predicted TSLA V.3 12 13 14 Date TSLA (at close) 15 1/2/2020 86.052002 16 1/3/2020 88.601997 17 1/6/2020 90.307999 18 1/7/2020 93.811996 19 1/8/2020 98.428001 20 1/9/2020 96.267998 21 1/10/2020 95.629997 22 1/13/2020 104.972 23 1/14/2020 107.584 24 1/15/2020 103.699997 25 1/16/2020 102.697998 26 1/17/onen 102 0999 14| SLOPE INTERCEPT RSQ STEYX Pred. Vol. 4/1/2020 Lower bound Upper Bound Predicted TSLA v.1 Predicted TSLA V.2 Predicted TSLA V.3 Future date 4/1/2021 4/8/2021 4/15/2021 4/22/2021 4/29/2021 G H B E D Lower bound Upper Bound Predicted TSLA V.1 Predicted TSLA V.2 Predicted TSLA V.3 93.811996 98.428001 96.267998 95.629997 104.972 107.584 103.699997 102.697998 102.099998 109.440002 113.912003 114.440002 112.963997 111.603996 113.379997 116.197998 128.162003 130.113998 156 177.412003 146.940002 Future date 4/1/2021 4/8/2021 4/15/2021 4/22/2021 4/29/2021 5/6/2021 5/13/2021 5/20/2021 5/27/2021 6/3/2021 6/10/2021 6/17/2021 6/24/2021 7/1/2021 A B B C D E 11 Predicted TSLA V.1 Predict SLOPE INTERCEPT RSQ STEYX Pred. Val. 4/1/2020 Lower bound Upper Bound Predicted TSLA V.1 Predic 12 13 14 Date TSLA (at close) 15 1/2/2020 86.052002 16 1/3/2020 88.601997 17 1/6/2020 90.307999 18 1/7/2020 93.811996 19 1/8/2020 98.428001 20 1/9/2020 96.267998 21 1/10/2020 95.629997 1/13/2020 104.972 23 1/14/2020 107.584 24 1/15/2020 103.699997 1/16/2020 102.697998 26 1/17/2020 102.099998 27 1/21/2020 109.440002 28 1/22/2020 113.912003 29 1/23/2020 114.440002 30 1/24/2020 112.963997 31 1/27/2020 111.603996 R2 1/28/2020 113.379997 22 25 Future date 4/1/2021 4/8/2021 4/15/2021 4/22/2021 4/29/2021 5/6/2021 5/13/2021 5/20/2021 5/27/2021 6/3/2021 6/10/2021 Points Available 2 3 3 Points You have been asked to analyze the trend in Tesla Stock price over time and predict future price in short/medium term Earnes First, insert a scatterplot of TSIA price trend over time; put it in li; add a trendline (does not have to be linear) that maximizes t-squared; display equation and r-squared You see that price has varried significantly over time you want to calculate the linear trend characteristics based on 3 time frames: using only the data for February 2021 (v.1), using the current year (2021) (v.2); and using all the data available (v.3). For the three different options, calculated the Slope, Intercept, R-squared, Standard error of the linear relationship Calculate also the predicted value on 4/1/21, lower bound (prediction - 2"standard error) and upper bound (prediction +2*standard error) Below, use the three options to forecast price until 7/1/2021 Based on the 3 forecasts, create a line chart showing predicted prices over time; place it in L20 6 S 3 3 2 7 8 10 B F G 5 6 7 8 3 3 2 D E H Calculate also the predicted value on 4/1/21, lower bound (prediction - 2*standard error) and upper bound (prediction +7'star Below, use the three options to forecast price until 7/1/2021 Based on the 3 forecasts, create a line chart showing predicted prices over time, place it in 120 9 10 11 Predicted TSLA V.1 Predicted TSLA V.2 Predicted TSLA V.3 12 13 14 Date TSLA (at close) 15 1/2/2020 86.052002 16 1/3/2020 88.601997 17 1/6/2020 90.307999 18 1/7/2020 93.811996 19 1/8/2020 98.428001 20 1/9/2020 96.267998 21 1/10/2020 95.629997 22 1/13/2020 104.972 23 1/14/2020 107.584 24 1/15/2020 103.699997 25 1/16/2020 102.697998 26 1/17/onen 102 0999 14| SLOPE INTERCEPT RSQ STEYX Pred. Vol. 4/1/2020 Lower bound Upper Bound Predicted TSLA v.1 Predicted TSLA V.2 Predicted TSLA V.3 Future date 4/1/2021 4/8/2021 4/15/2021 4/22/2021 4/29/2021 G H B E D Lower bound Upper Bound Predicted TSLA V.1 Predicted TSLA V.2 Predicted TSLA V.3 93.811996 98.428001 96.267998 95.629997 104.972 107.584 103.699997 102.697998 102.099998 109.440002 113.912003 114.440002 112.963997 111.603996 113.379997 116.197998 128.162003 130.113998 156 177.412003 146.940002 Future date 4/1/2021 4/8/2021 4/15/2021 4/22/2021 4/29/2021 5/6/2021 5/13/2021 5/20/2021 5/27/2021 6/3/2021 6/10/2021 6/17/2021 6/24/2021 7/1/2021 A B B C D E 11 Predicted TSLA V.1 Predict SLOPE INTERCEPT RSQ STEYX Pred. Val. 4/1/2020 Lower bound Upper Bound Predicted TSLA V.1 Predic 12 13 14 Date TSLA (at close) 15 1/2/2020 86.052002 16 1/3/2020 88.601997 17 1/6/2020 90.307999 18 1/7/2020 93.811996 19 1/8/2020 98.428001 20 1/9/2020 96.267998 21 1/10/2020 95.629997 1/13/2020 104.972 23 1/14/2020 107.584 24 1/15/2020 103.699997 1/16/2020 102.697998 26 1/17/2020 102.099998 27 1/21/2020 109.440002 28 1/22/2020 113.912003 29 1/23/2020 114.440002 30 1/24/2020 112.963997 31 1/27/2020 111.603996 R2 1/28/2020 113.379997 22 25 Future date 4/1/2021 4/8/2021 4/15/2021 4/22/2021 4/29/2021 5/6/2021 5/13/2021 5/20/2021 5/27/2021 6/3/2021 6/10/2021
Step by Step Solution
There are 3 Steps involved in it

Get step-by-step solutions from verified subject matter experts