

Question: Please help with E-I with explanations on how to find beta Evaluating Risk and Return a. Calculating the annual rates of return for Bartman, Reynolds,
Please help with E-I with explanations on how to find beta
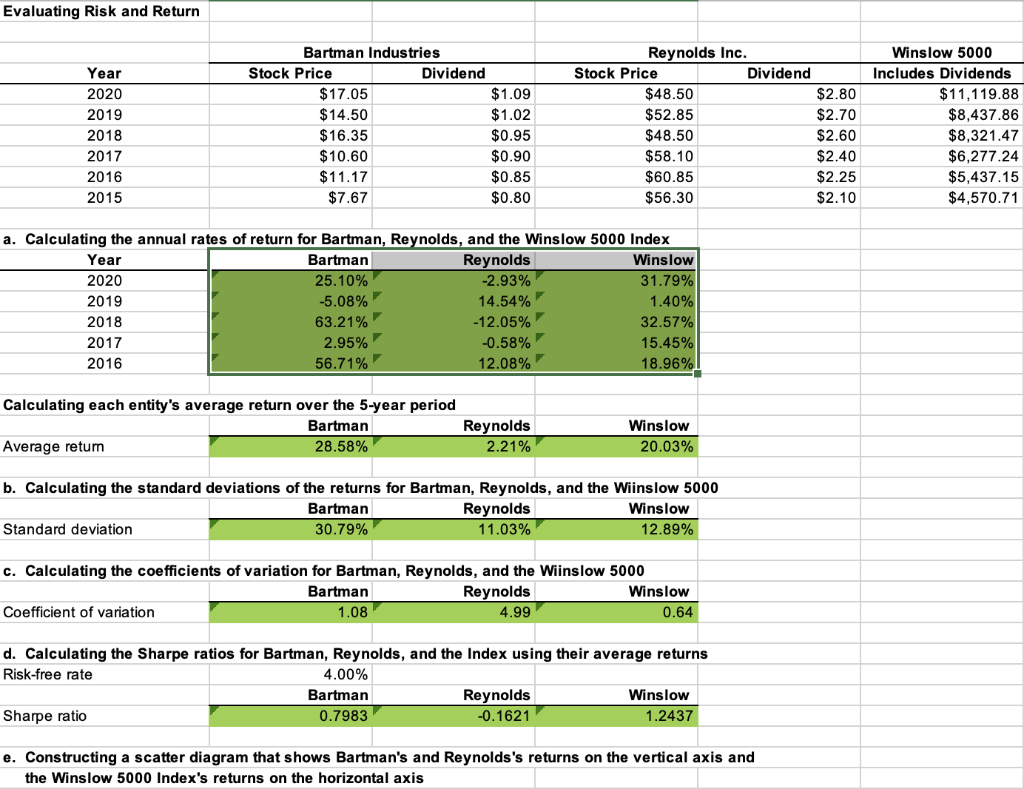
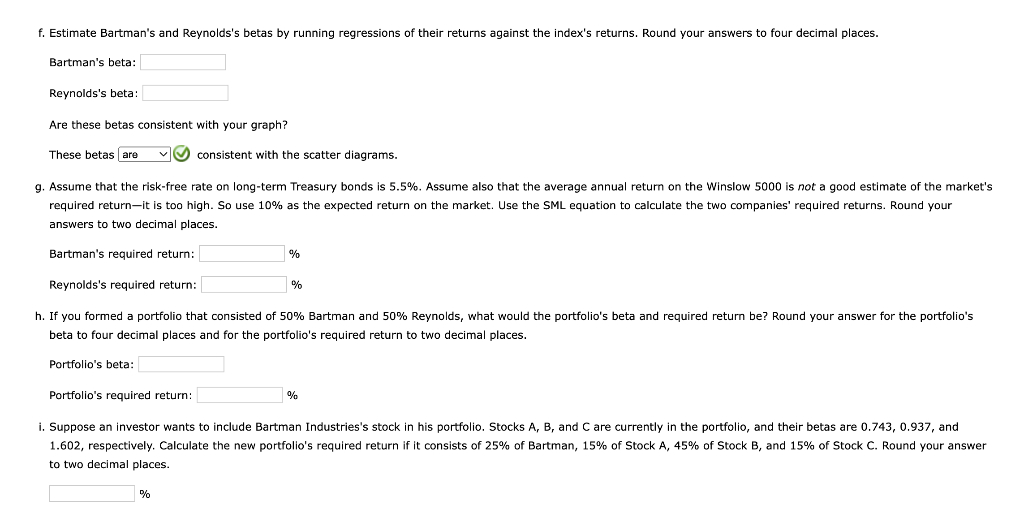
Evaluating Risk and Return a. Calculating the annual rates of return for Bartman, Reynolds, and the Winslow 5000 Index \begin{tabular}{r|rr|r|} \hline Year & Bartman & Reynolds & \multicolumn{1}{|c|}{ Winslow } \\ \hline 2020 & 25.10% & 2.93% & 31.79% \\ \hline 2019 & 5.08% & 14.54% & 3.40% \\ 2018 & 63.21% & 12.05% & 15.57% \\ \hline 2017 & 2.95% & 0.58% & 18.95% \\ \hline 2016 & 56.71% & 12.08% & \\ \hline \end{tabular} Calculating each entity's average return over the 5-year period Average retum \begin{tabular}{|rrr|} Bartman & Reynolds & Winslow \\ \hline 28.58% & 2.21% & 20.03% \end{tabular} b. Calculating the standard deviations of the returns for Bartman, Reynolds, and the Wiinslow 5000 Standard deviation \begin{tabular}{|r|r|r|} \hline Bartman & Reynolds & Winslow \\ \hline 30.79% & 11.03% & 12.89% \end{tabular} c. Calculating the coefficients of variation for Bartman, Reynolds, and the Wiinslow 5000 \begin{tabular}{lrrr} & Bartman & Reynolds & Winslow \\ \cline { 2 - 4 } Coefficient of variation & 1.08 & 4.99 & 0.64 \end{tabular} d. Calculating the Sharpe ratios for Bartman, Reynolds, and the Index using their average returns Risk-free rate Sharpe ratio \begin{tabular}{rrrr} Bartman & Reynolds & Winslow \\ \hline 0.7983 & 0.1621 & 1.2437 \end{tabular} e. Constructing a scatter diagram that shows Bartman's and Reynolds's returns on the vertical axis and the Winslow 5000 Index's returns on the horizontal axis f. Estimate Bartman's and Reynolds's betas by running regressions of their returns against the index's returns. Round your answers to four decimal places. Bartman's beta: Reynolds's beta: Are these betas consistent with your graph? These betas consistent with the scatter diagrams. g. Assume that the risk-free rate on long-term Treasury bonds is 5.5%. Assume also that the average annual return on the Winslow 5000 is not a good estimate of the market's required return-it is too high. So use 10% as the expected return on the market. Use the SML equation to calculate the two companies' required returns. Round your answers to two decimal places. Bartman's required return: Reynolds's required return: % h. If you formed a portfolio that consisted of 50% Bartman and 50% Reynolds, what would the portfolio's beta and required return be? Round your answer for the portfolio's beta to four decimal places and for the portfolio's required return to two decimal places. Portfolio's beta: Portfolio's required return: % i. Suppose an investor wants to include Bartman Industries's stock in his portfolio. Stocks A, B, and C are currently in the portfolio, and their betas are 0.743, 0.937, and 1.602, respectively. Calculate the new portfolio's required return if it consists of 25% of Bartman, 15% of Stock A, 45% of Stock B, and 15% of Stock C. Round your answer to two decimal places. % Evaluating Risk and Return a. Calculating the annual rates of return for Bartman, Reynolds, and the Winslow 5000 Index \begin{tabular}{r|rr|r|} \hline Year & Bartman & Reynolds & \multicolumn{1}{|c|}{ Winslow } \\ \hline 2020 & 25.10% & 2.93% & 31.79% \\ \hline 2019 & 5.08% & 14.54% & 3.40% \\ 2018 & 63.21% & 12.05% & 15.57% \\ \hline 2017 & 2.95% & 0.58% & 18.95% \\ \hline 2016 & 56.71% & 12.08% & \\ \hline \end{tabular} Calculating each entity's average return over the 5-year period Average retum \begin{tabular}{|rrr|} Bartman & Reynolds & Winslow \\ \hline 28.58% & 2.21% & 20.03% \end{tabular} b. Calculating the standard deviations of the returns for Bartman, Reynolds, and the Wiinslow 5000 Standard deviation \begin{tabular}{|r|r|r|} \hline Bartman & Reynolds & Winslow \\ \hline 30.79% & 11.03% & 12.89% \end{tabular} c. Calculating the coefficients of variation for Bartman, Reynolds, and the Wiinslow 5000 \begin{tabular}{lrrr} & Bartman & Reynolds & Winslow \\ \cline { 2 - 4 } Coefficient of variation & 1.08 & 4.99 & 0.64 \end{tabular} d. Calculating the Sharpe ratios for Bartman, Reynolds, and the Index using their average returns Risk-free rate Sharpe ratio \begin{tabular}{rrrr} Bartman & Reynolds & Winslow \\ \hline 0.7983 & 0.1621 & 1.2437 \end{tabular} e. Constructing a scatter diagram that shows Bartman's and Reynolds's returns on the vertical axis and the Winslow 5000 Index's returns on the horizontal axis f. Estimate Bartman's and Reynolds's betas by running regressions of their returns against the index's returns. Round your answers to four decimal places. Bartman's beta: Reynolds's beta: Are these betas consistent with your graph? These betas consistent with the scatter diagrams. g. Assume that the risk-free rate on long-term Treasury bonds is 5.5%. Assume also that the average annual return on the Winslow 5000 is not a good estimate of the market's required return-it is too high. So use 10% as the expected return on the market. Use the SML equation to calculate the two companies' required returns. Round your answers to two decimal places. Bartman's required return: Reynolds's required return: % h. If you formed a portfolio that consisted of 50% Bartman and 50% Reynolds, what would the portfolio's beta and required return be? Round your answer for the portfolio's beta to four decimal places and for the portfolio's required return to two decimal places. Portfolio's beta: Portfolio's required return: % i. Suppose an investor wants to include Bartman Industries's stock in his portfolio. Stocks A, B, and C are currently in the portfolio, and their betas are 0.743, 0.937, and 1.602, respectively. Calculate the new portfolio's required return if it consists of 25% of Bartman, 15% of Stock A, 45% of Stock B, and 15% of Stock C. Round your answer to two decimal places. %
Step by Step Solution
There are 3 Steps involved in it

Get step-by-step solutions from verified subject matter experts