

Question: please help with excel graphs stated on question 2, the time period is 12 months if you could, please show formula so that i can
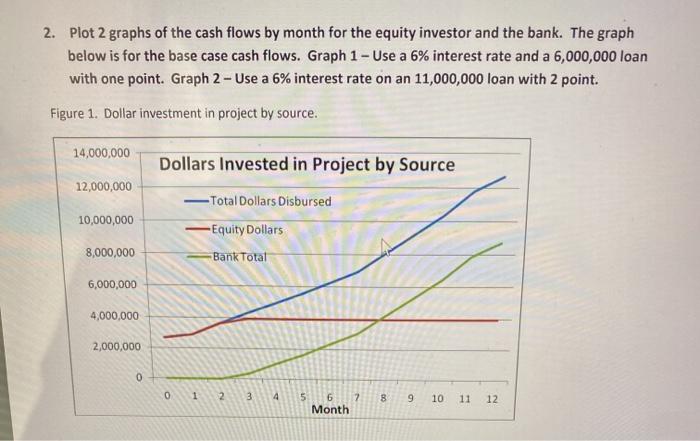
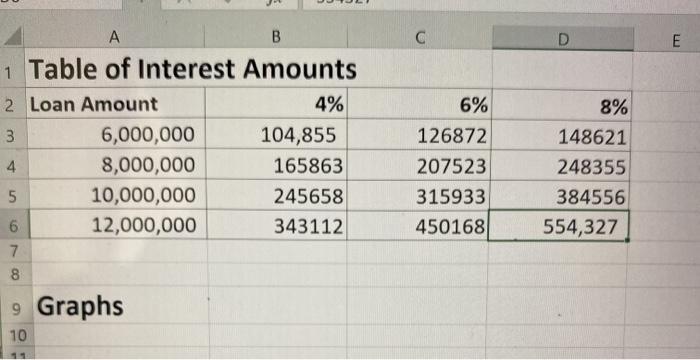
2. Plot 2 graphs of the cash flows by month for the equity investor and the bank. The graph below is for the base case cash flows. Graph 1 - Use a 6% interest rate and a 6,000,000 loan with one point. Graph 2 - Use a 6% interest rate on an 11,000,000 loan with 2 point. Figure 1. Dollar investment in project by source. 14,000,000 Dollars Invested in Project by Source 12,000,000 10,000,000 -Total Dollars Disbursed -Equity Dollars 8,000,000 Bank Total 6,000,000 4,000,000 2,000,000 0 0 1 2 8 9 9 5 6 7 Month 10 11 12 E A B 1 Table of Interest Amounts 2 Loan Amount 4% 3 6,000,000 104,855 4 8,000,000 165863 5 10,000,000 245658 6 12,000,000 343112 7 8 9 Graphs 10 6% 126872 207523 315933 450168 8% 148621 248355 384556 554,327 2. Plot 2 graphs of the cash flows by month for the equity investor and the bank. The graph below is for the base case cash flows. Graph 1 - Use a 6% interest rate and a 6,000,000 loan with one point. Graph 2 - Use a 6% interest rate on an 11,000,000 loan with 2 point. Figure 1. Dollar investment in project by source. 14,000,000 Dollars Invested in Project by Source 12,000,000 10,000,000 -Total Dollars Disbursed -Equity Dollars 8,000,000 Bank Total 6,000,000 4,000,000 2,000,000 0 0 1 2 8 9 9 5 6 7 Month 10 11 12 E A B 1 Table of Interest Amounts 2 Loan Amount 4% 3 6,000,000 104,855 4 8,000,000 165863 5 10,000,000 245658 6 12,000,000 343112 7 8 9 Graphs 10 6% 126872 207523 315933 450168 8% 148621 248355 384556 554,327
Step by Step Solution
There are 3 Steps involved in it

Get step-by-step solutions from verified subject matter experts