

Question: Please help with exercise 6. This is MATLAB programming. EXAMPLE 6: Compare percentages using scaling and explicit bin positions Create a new cell in which
Please help with exercise 6. This is MATLAB programming.
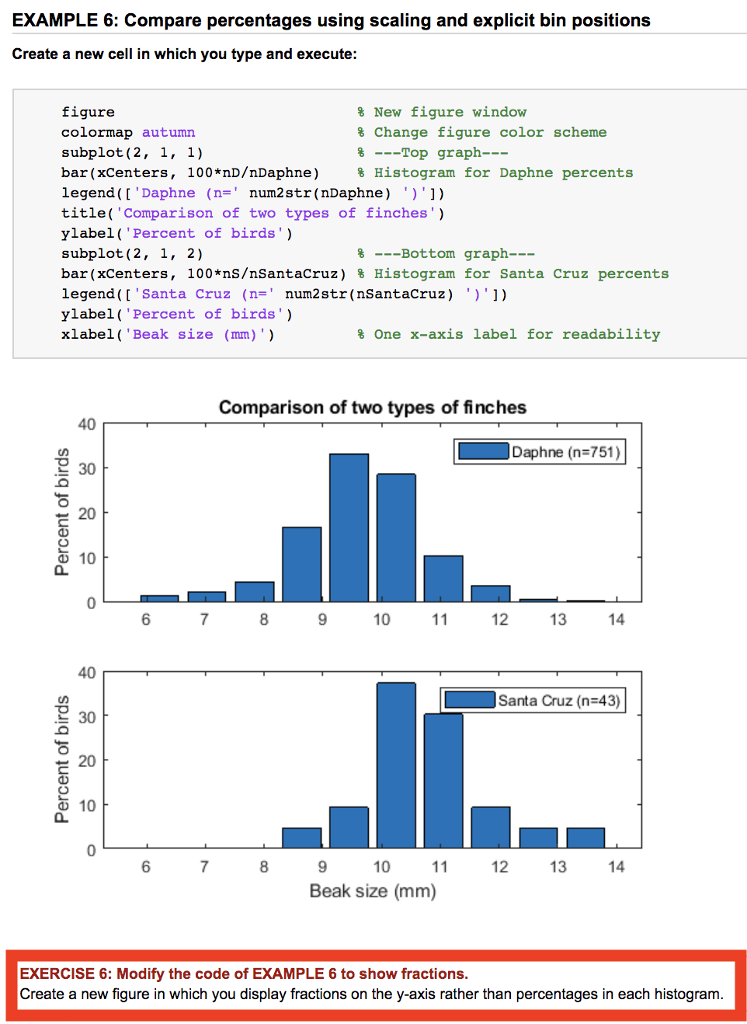
EXAMPLE 6: Compare percentages using scaling and explicit bin positions Create a new cell in which you type and execute: % New figure window % Change figure color scheme % Top graph figure colormap autumn subplot (2, 1, 1) bar (xCenters, 100*nDDaphne) % Histogram for Daphne percents legend ( [ ' Daphne (n=' num2 str (nDaphne) ' ) ' ] ) title Comparison of two types of finches') ylabel(Percent of birds') subplot (2, 1, 2) bar ( xcenters, 100*nssantacruz) % Histogram for Santa Cruz percents legend (['Santa Cruz (n- num2str (nSantaCruz)')'1) ylabel(Percent of birds) xlabel('Beak size (mm)') % Bottom graph % one x-axis label for readability Comparison of two types of finches 40 Daphne (n 751) 2 30 D 10 0 6 10 12 13 40 Santa Cruz (n=43) 30 10 6 8 9 10 13 Beak size (mm) EXERCISE 6: Modify the code of EXAMPLE 6 to show fractions Create a new figure in which you display fractions on the y-axis rather than percentages in each histogram
Step by Step Solution
There are 3 Steps involved in it

Get step-by-step solutions from verified subject matter experts