

Question: Please help with explanation. Please read the following R scripts for estimating CAPM for IBM stock and answer questions from 15 to 20. > setwd(-/Dropbox/Teaching/EF4822_Spring2020)
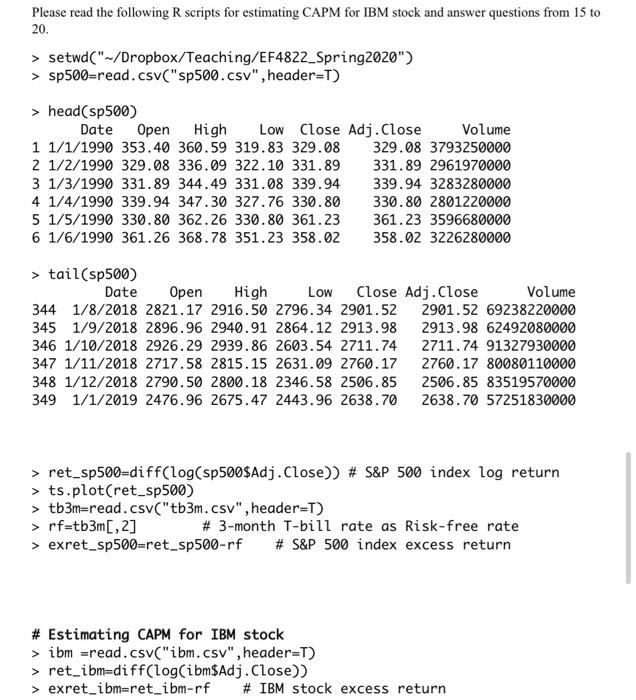
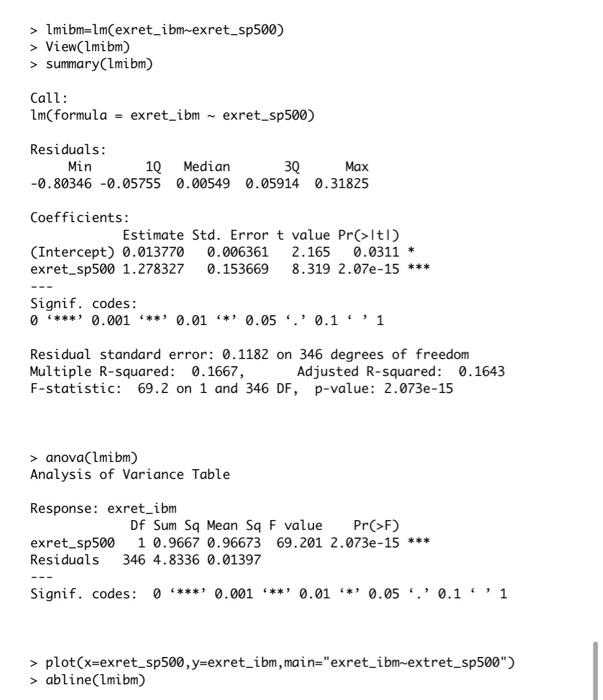
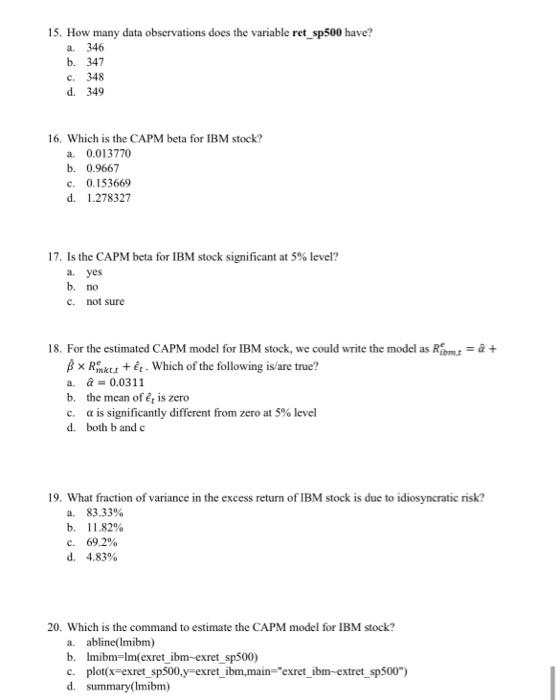
Please read the following R scripts for estimating CAPM for IBM stock and answer questions from 15 to 20. > setwd("-/Dropbox/Teaching/EF4822_Spring2020") > sp500=read.csv"sp500.csv", header=T) > head(sp500) Date Open High Low Close Adj.Close Volume 1 1/1/1990 353.40 360.59 319.83 329.08 329.08 3793250000 2 1/2/1990 329.08 336.09 322.10 331.89 331.89 2961970000 3 1/3/1990 331.89 344.49 331.08 339.94 339.94 3283280000 4 1/4/1990 339.94 347.30 327.76 330.80 330.80 2801220000 5 1/5/1990 330.80 362.26 330.80 361.23 361.23 3596680000 6 1/6/1990 361.26 368.78 351.23 358.02 358.02 3226280000 > tail(sp500) Date Open High LOW Close Adj.Close Volume 344 1/8/2018 2821.17 2916.50 2796.34 2901.52 2901.52 69238220000 345 1/9/2018 2896.96 2940.91 2864.12 2913.98 2913.98 62492080000 346 1/10/2018 2926.29 2939.86 2603.54 2711.74 2711.74 91327930000 347 1/11/2018 2717.58 2815.15 2631.09 2760.17 2760.17 80080110000 348 1/12/2018 2790.50 2800.18 2346.58 2506.85 2506.85 83519570000 349 1/1/2019 2476.96 2675.47 2443.96 2638.70 2638.70 57251830000 > ret_sp500=diff(log(sp500$Adj.Close)) # S&P 500 index log return > ts.plot(ret_sp500) > tb3m=read.csv ("tb3m.csv", header=T) > rf=tb3m[,2] # 3-month T-bill rate as Risk-free rate > exret_sp500=ret_sp500-rf # S&P 500 index excess return # Estimating CAPM for IBM stock > ibm =read.csv"ibm.csv", header=T) > ret_ibm=diff(log(ibm$Adj.Close)) > exret_ibm-ret_ibm-rf # IBM stock excess return > Imibm=Lm(exret_ibm-exret_sp500) > View(lmibm > summary(lmibm) Call: Im(formula = exret_ibm - exret_sp500) Residuals: Min 1Q Median 30 Max -0.80346 -0.05755 0.00549 0.05914 0.31825 Coefficients: Estimate Std. Error t value Pr(>It!) (Intercept) 0.013770 0.006361 2.165 0.0311 * exret_sp500 1.278327 0.153669 8.319 2.07e-15 *** Signif. codes: ****' 0.001 ***' 0.01 **' 0.05.' 0.1''1 Residual standard error: 0.1182 on 346 degrees of freedom Multiple R-squared: 0.1667, Adjusted R-squared: 0.1643 F-statistic: 69.2 on 1 and 346 DF, p-value: 2.073e-15 > anova(Imibm) Analysis of Variance Table Response: exret_ibm Of Sum Sq Mean Sq F value Pr(>F) exret_sp500 1 0.9667 0.96673 69.201 2.073e-15 *** Residuals 346 4.8336 0.01397 Signif. codes: 0 ** 0.001 ***' 0.01 "*0.05.' 0.1'' 1 > plot(x=exret_sp500, y=exret_ibm, main="exret_ibm-extret_sp500") > abline(Lmibm) 15. How many data observations does the variable ret_sp500 have? a. 346 b. 347 c. 348 d. 349 16. Which is the CAPM beta for IBM stock? a. 0.013770 b. 0.9667 c. 0.153669 d. 1.278327 17. Is the CAPM beta for IBM stock significant at 5% level? a. yes b. no c. not sure 18. For the estimated CAPM model for IBM stock, we could write the model as Rome = a + B x Rank: + . Which of the following is/are true? a. -0.0311 b. the mean of , is zero c. a is significantly different from zero at 5% level d. both band c 19. What fraction of variance in the excess return of IBM stock is due to idiosyncratic risk? a. 83.33% b. 11.82% c. 69.2% d. 4.83% 20. Which is the command to estimate the CAPM model for IBM stock? a. abline(Imibm) b. Imibm-Im(exret_ibm-exret_sp500) c. plot(x-exret_sp500.y-exret_ibm.main="exret_ibm-extret_sp500") d. summary(Imibm) Please read the following R scripts for estimating CAPM for IBM stock and answer questions from 15 to 20. > setwd("-/Dropbox/Teaching/EF4822_Spring2020") > sp500=read.csv"sp500.csv", header=T) > head(sp500) Date Open High Low Close Adj.Close Volume 1 1/1/1990 353.40 360.59 319.83 329.08 329.08 3793250000 2 1/2/1990 329.08 336.09 322.10 331.89 331.89 2961970000 3 1/3/1990 331.89 344.49 331.08 339.94 339.94 3283280000 4 1/4/1990 339.94 347.30 327.76 330.80 330.80 2801220000 5 1/5/1990 330.80 362.26 330.80 361.23 361.23 3596680000 6 1/6/1990 361.26 368.78 351.23 358.02 358.02 3226280000 > tail(sp500) Date Open High LOW Close Adj.Close Volume 344 1/8/2018 2821.17 2916.50 2796.34 2901.52 2901.52 69238220000 345 1/9/2018 2896.96 2940.91 2864.12 2913.98 2913.98 62492080000 346 1/10/2018 2926.29 2939.86 2603.54 2711.74 2711.74 91327930000 347 1/11/2018 2717.58 2815.15 2631.09 2760.17 2760.17 80080110000 348 1/12/2018 2790.50 2800.18 2346.58 2506.85 2506.85 83519570000 349 1/1/2019 2476.96 2675.47 2443.96 2638.70 2638.70 57251830000 > ret_sp500=diff(log(sp500$Adj.Close)) # S&P 500 index log return > ts.plot(ret_sp500) > tb3m=read.csv ("tb3m.csv", header=T) > rf=tb3m[,2] # 3-month T-bill rate as Risk-free rate > exret_sp500=ret_sp500-rf # S&P 500 index excess return # Estimating CAPM for IBM stock > ibm =read.csv"ibm.csv", header=T) > ret_ibm=diff(log(ibm$Adj.Close)) > exret_ibm-ret_ibm-rf # IBM stock excess return > Imibm=Lm(exret_ibm-exret_sp500) > View(lmibm > summary(lmibm) Call: Im(formula = exret_ibm - exret_sp500) Residuals: Min 1Q Median 30 Max -0.80346 -0.05755 0.00549 0.05914 0.31825 Coefficients: Estimate Std. Error t value Pr(>It!) (Intercept) 0.013770 0.006361 2.165 0.0311 * exret_sp500 1.278327 0.153669 8.319 2.07e-15 *** Signif. codes: ****' 0.001 ***' 0.01 **' 0.05.' 0.1''1 Residual standard error: 0.1182 on 346 degrees of freedom Multiple R-squared: 0.1667, Adjusted R-squared: 0.1643 F-statistic: 69.2 on 1 and 346 DF, p-value: 2.073e-15 > anova(Imibm) Analysis of Variance Table Response: exret_ibm Of Sum Sq Mean Sq F value Pr(>F) exret_sp500 1 0.9667 0.96673 69.201 2.073e-15 *** Residuals 346 4.8336 0.01397 Signif. codes: 0 ** 0.001 ***' 0.01 "*0.05.' 0.1'' 1 > plot(x=exret_sp500, y=exret_ibm, main="exret_ibm-extret_sp500") > abline(Lmibm) 15. How many data observations does the variable ret_sp500 have? a. 346 b. 347 c. 348 d. 349 16. Which is the CAPM beta for IBM stock? a. 0.013770 b. 0.9667 c. 0.153669 d. 1.278327 17. Is the CAPM beta for IBM stock significant at 5% level? a. yes b. no c. not sure 18. For the estimated CAPM model for IBM stock, we could write the model as Rome = a + B x Rank: + . Which of the following is/are true? a. -0.0311 b. the mean of , is zero c. a is significantly different from zero at 5% level d. both band c 19. What fraction of variance in the excess return of IBM stock is due to idiosyncratic risk? a. 83.33% b. 11.82% c. 69.2% d. 4.83% 20. Which is the command to estimate the CAPM model for IBM stock? a. abline(Imibm) b. Imibm-Im(exret_ibm-exret_sp500) c. plot(x-exret_sp500.y-exret_ibm.main="exret_ibm-extret_sp500") d. summary(Imibm)
Step by Step Solution
There are 3 Steps involved in it

Get step-by-step solutions from verified subject matter experts